Afagh documentation
Everything you need to run your fleet from one screen: adding servers, reading the dashboard, setting up checks and alerts, and acting on what you find. Screenshots follow the theme you pick above.
Getting started
Afagh monitors your servers, runs scripts against them over SSH, and tells you when something breaks. Three steps take you from an empty account to a fleet you can see:
- Create a fleet — a named group of servers, such as
ProductionorStaging. - Add a server to that fleet, with an SSH key or a username and password.
- Install the agent from the server's own page. Metrics start arriving within a minute.
Everything else — uptime checks, alerting, service restarts, scripted operations — builds on that one agent connection. There is nothing further to install per feature.
Signing in happens at dash. your Afagh domain. The public site,
pricing and this documentation live on the main domain.
Fleets & servers
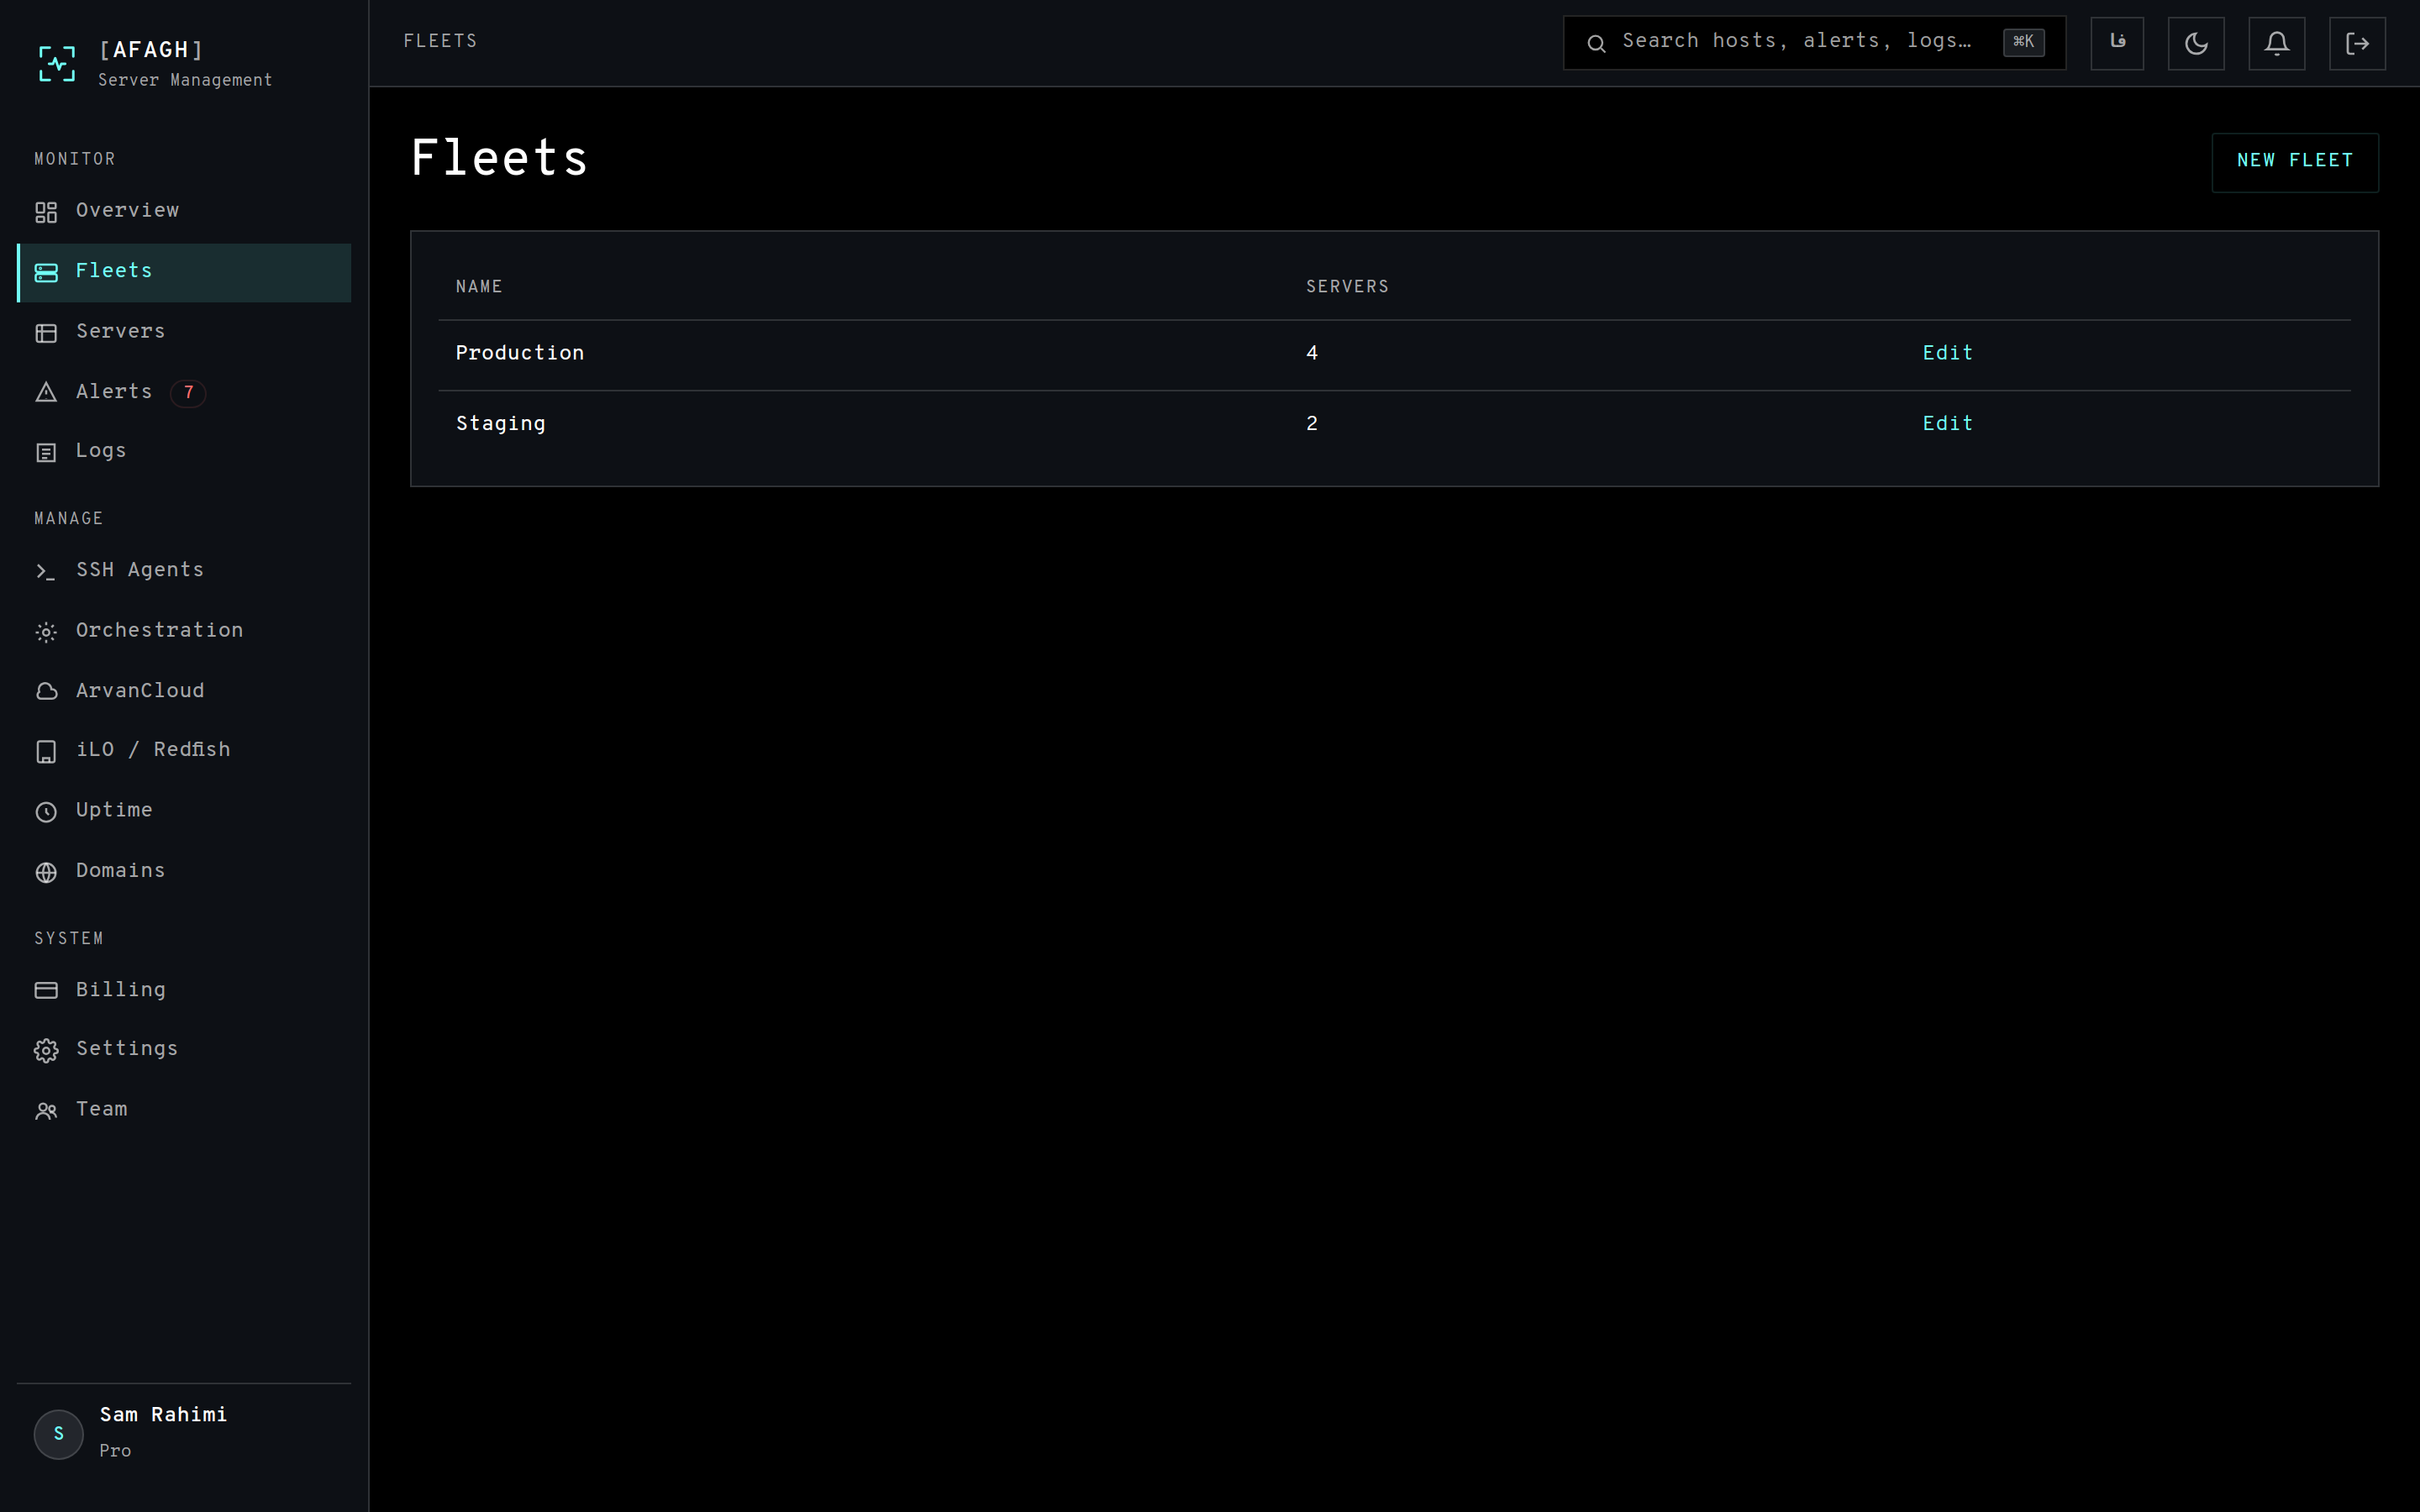
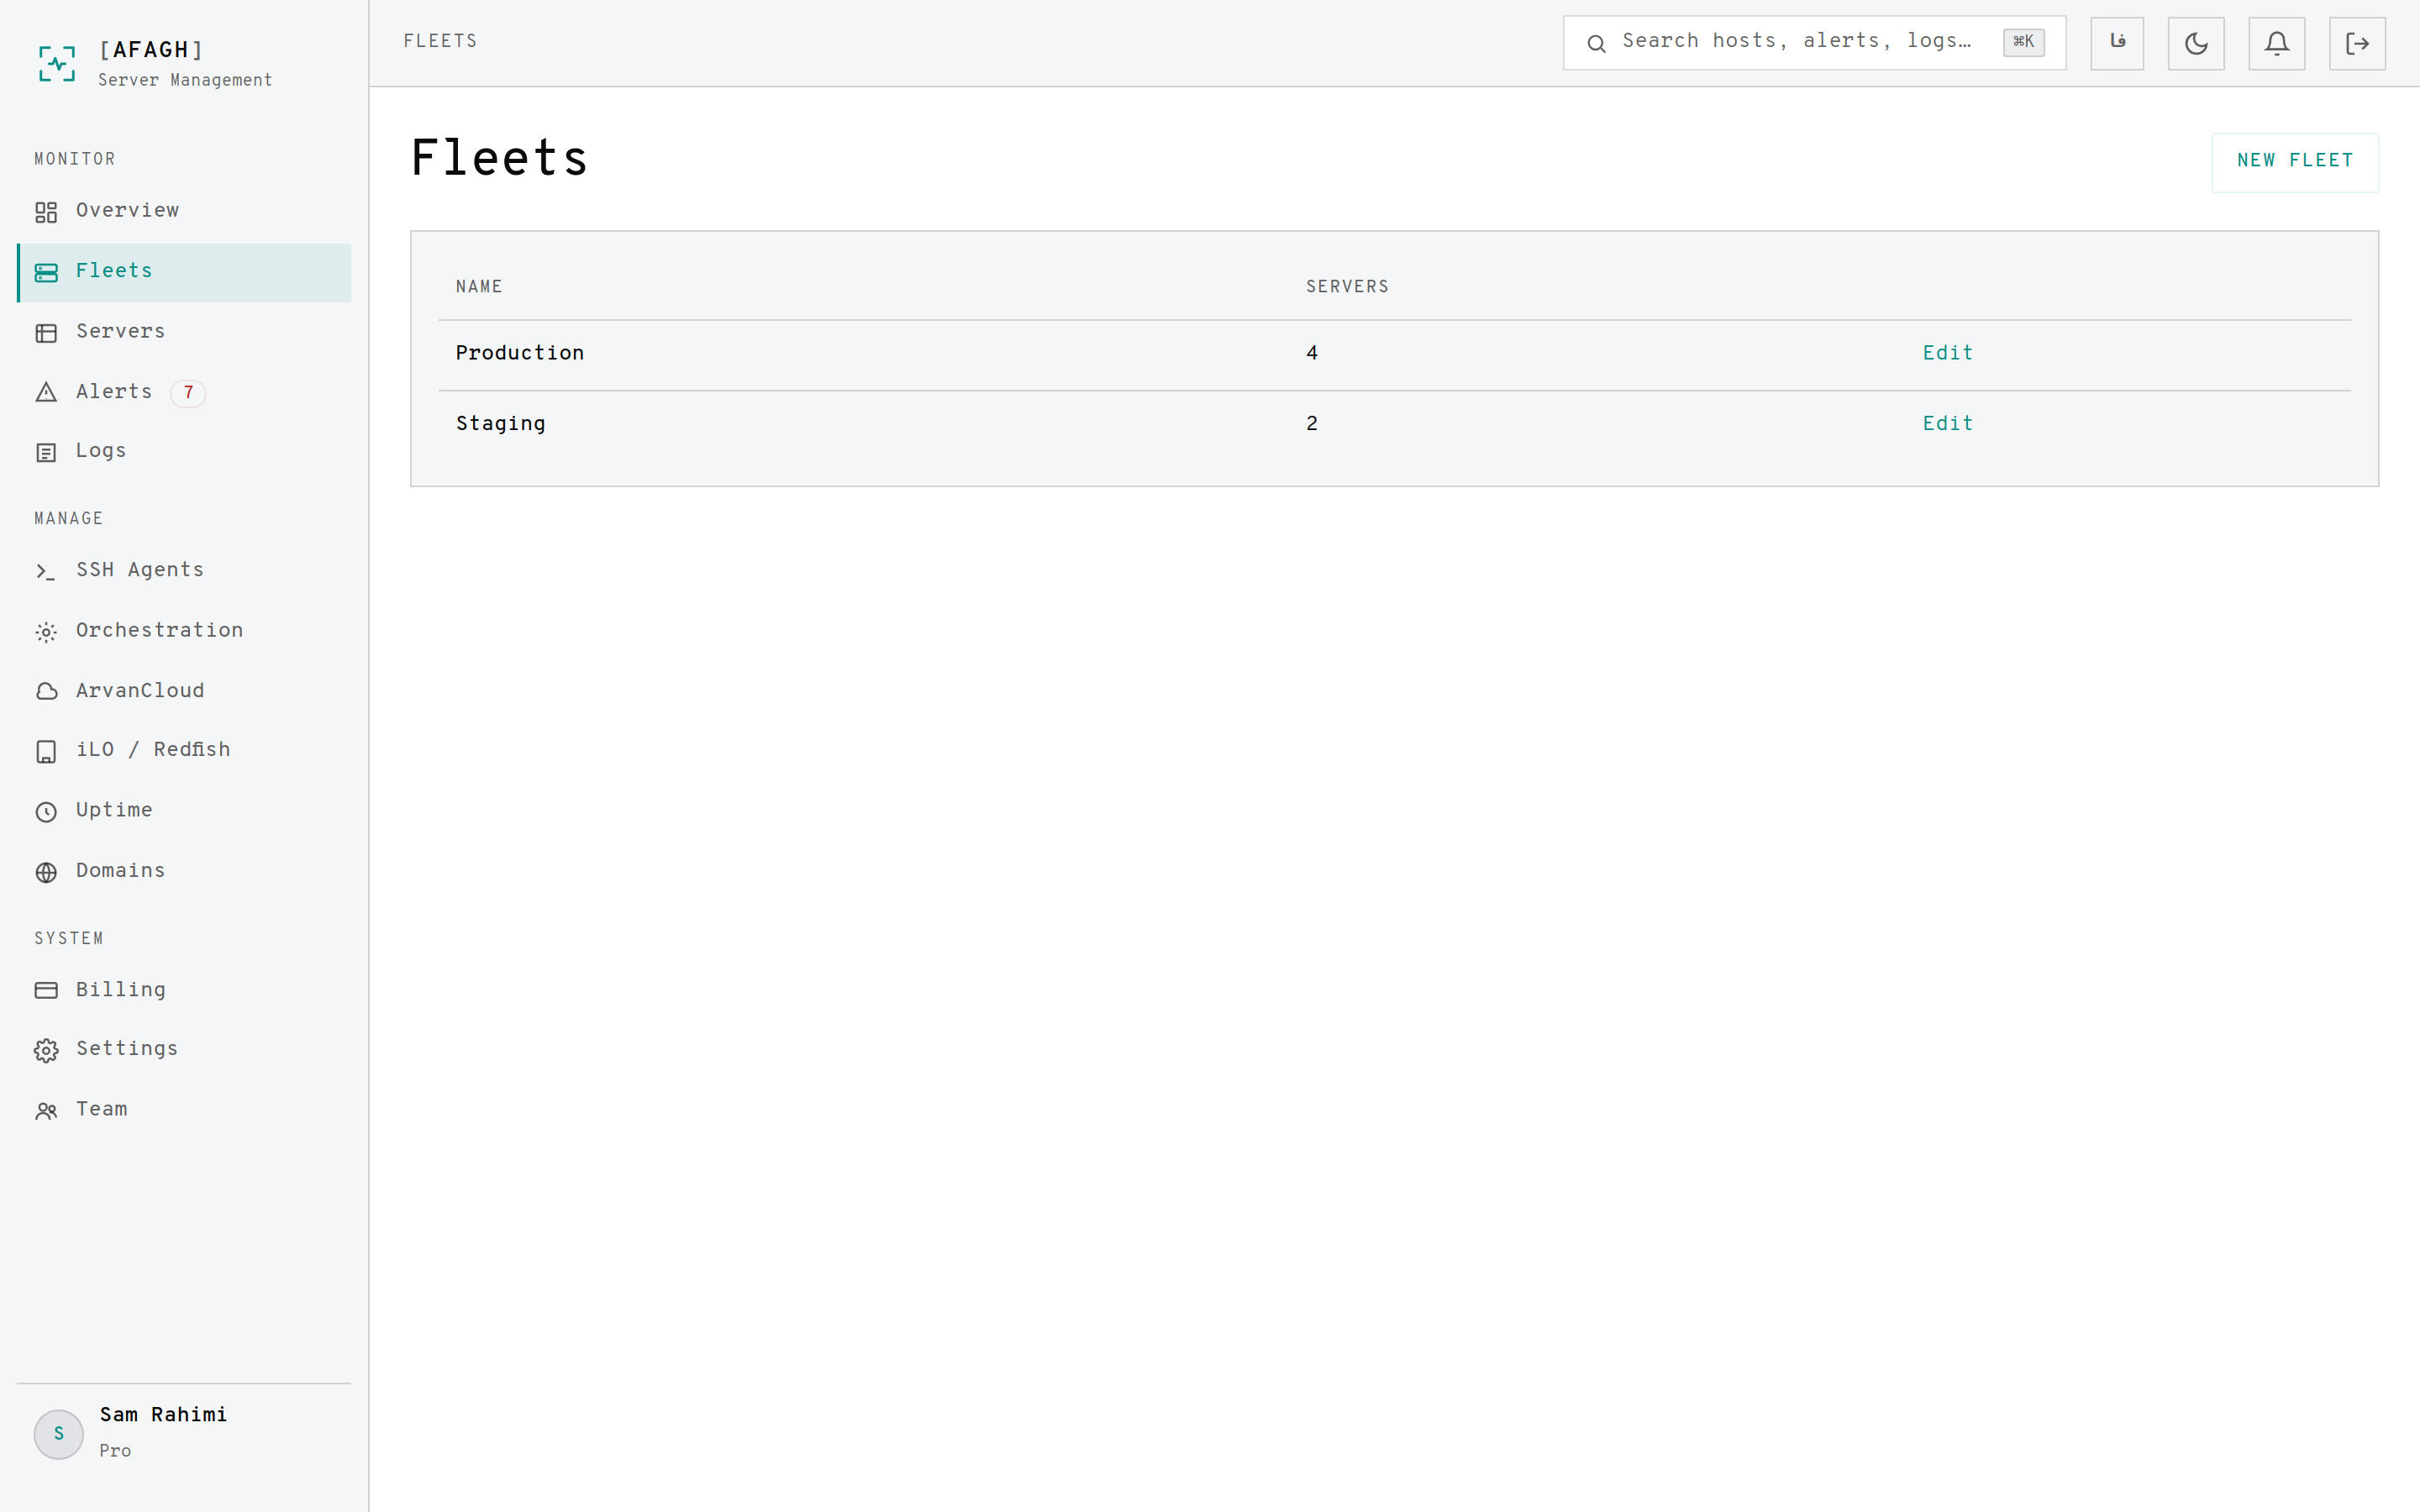
A fleet is a named group of servers. Use fleets to separate environments or regions — they are how dashboards, alerts and plan limits are scoped.
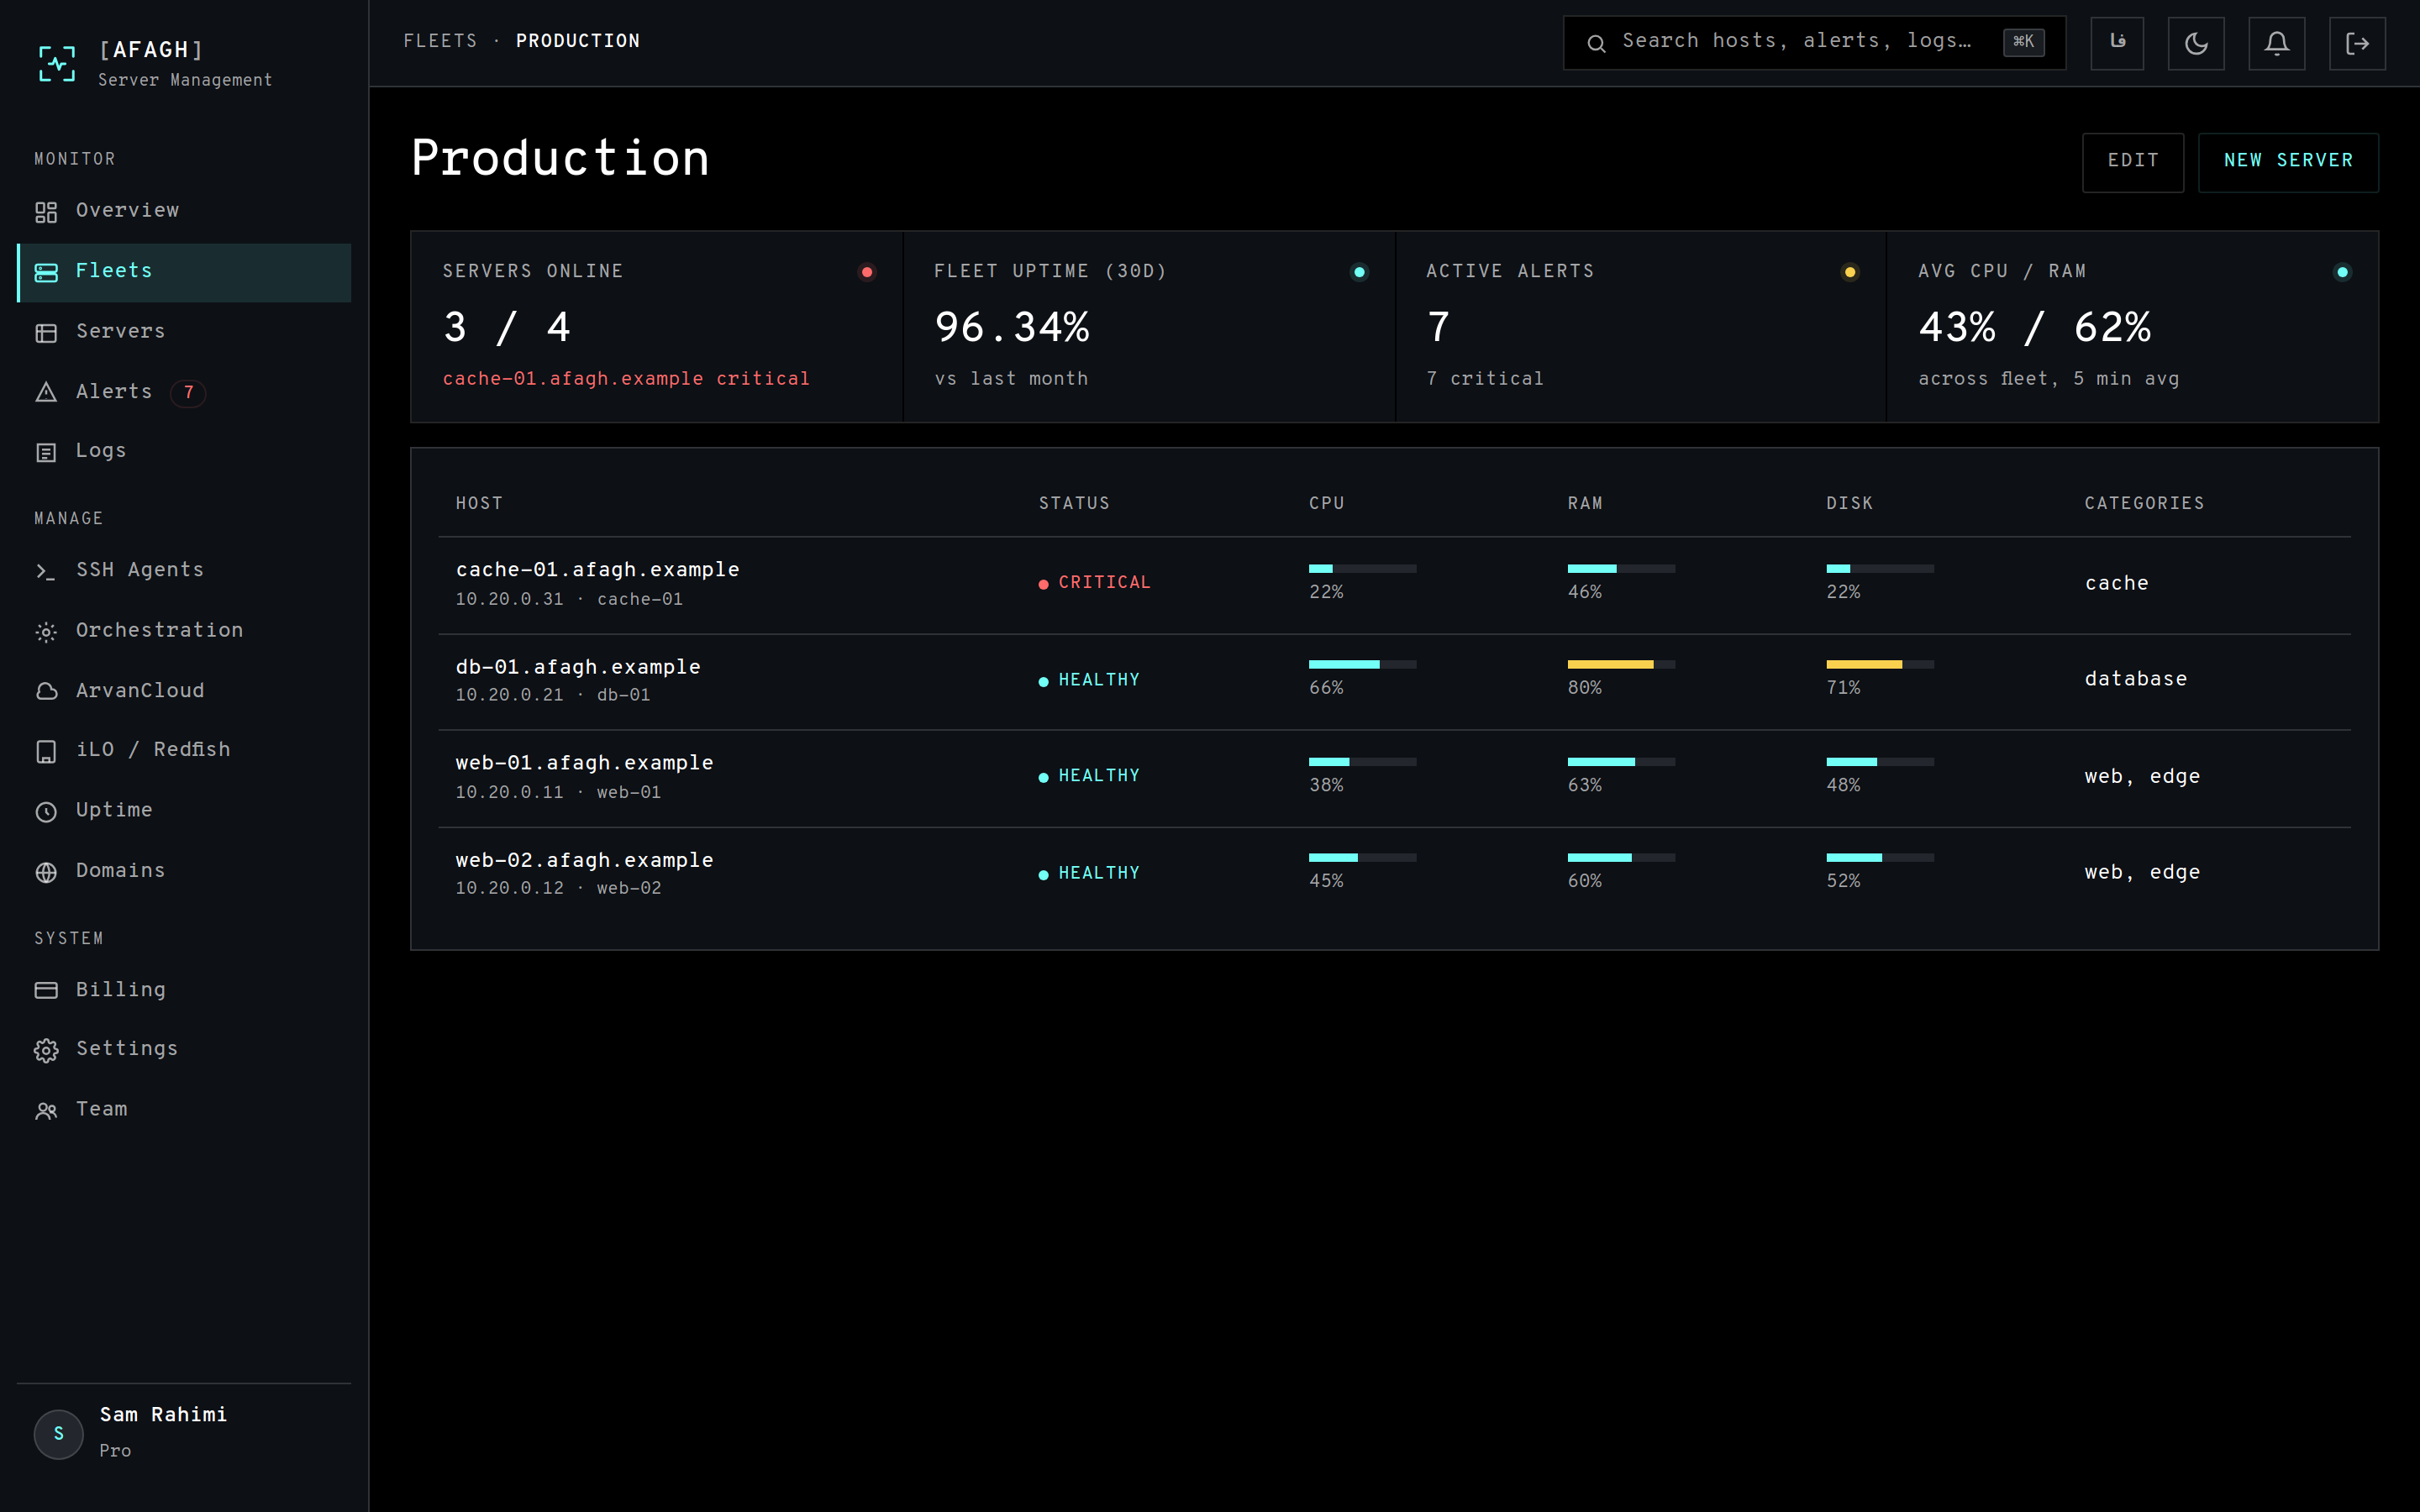
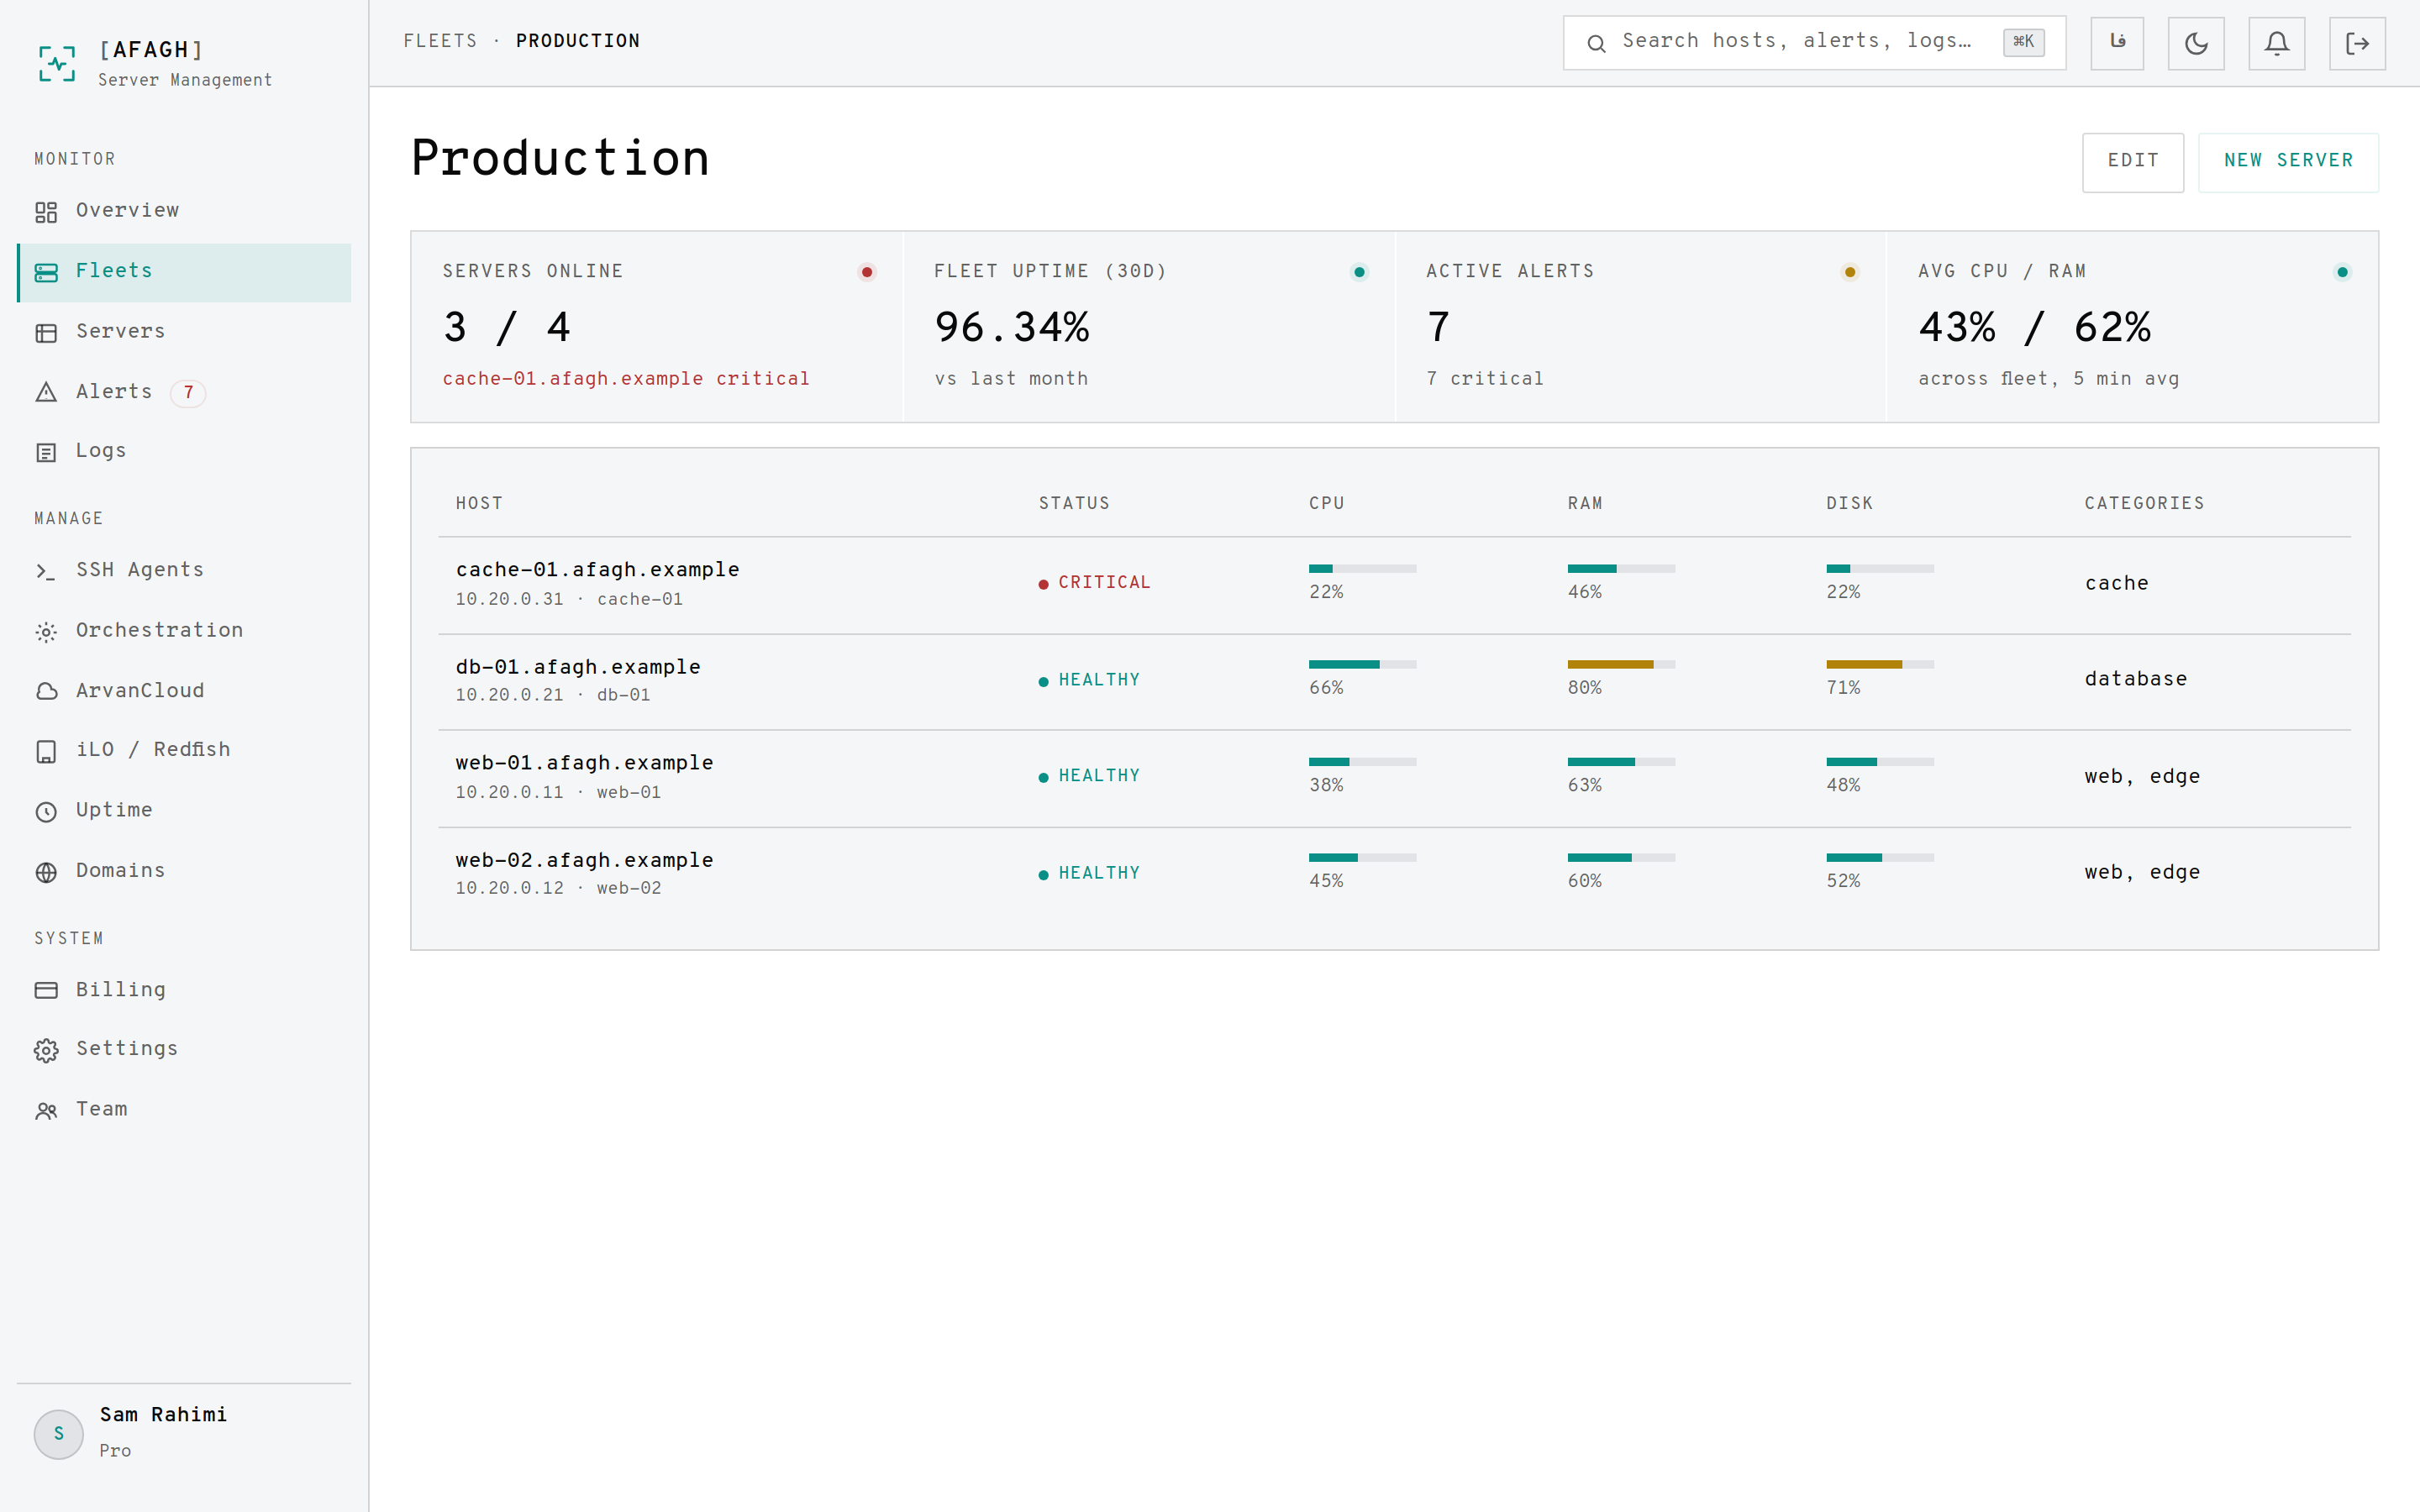
Opening a fleet shows the same KPI row as the main dashboard, scoped to just that fleet's servers: how many are online, uptime over the last 30 days, open alerts, and average CPU and memory.
Adding a server
Each server needs a name, an address, and SSH credentials so Afagh can install the agent and run scripts. You can paste a private key or use a username and password — both are encrypted before they are stored.
Installing the agent
From a server's page, open the Agent tab and start the install. Afagh connects over SSH, installs a small binary, and registers it as a service. The agent then connects back to Afagh over an outbound websocket and reports every 60 seconds by default.
- The install log streams live — you can watch it succeed or fail.
- If the websocket ever drops, commands automatically fall back to direct SSH.
- The agent reports CPU, memory, disk, network, systemd service state and journal lines.
A server shows as offline once its agent has been quiet for more than 90 seconds — comfortably above the default 60-second interval, so one late tick will not flap the status.
The overview dashboard
The overview is the front page of your account, and it updates itself — new metrics, check results and alerts appear without reloading.
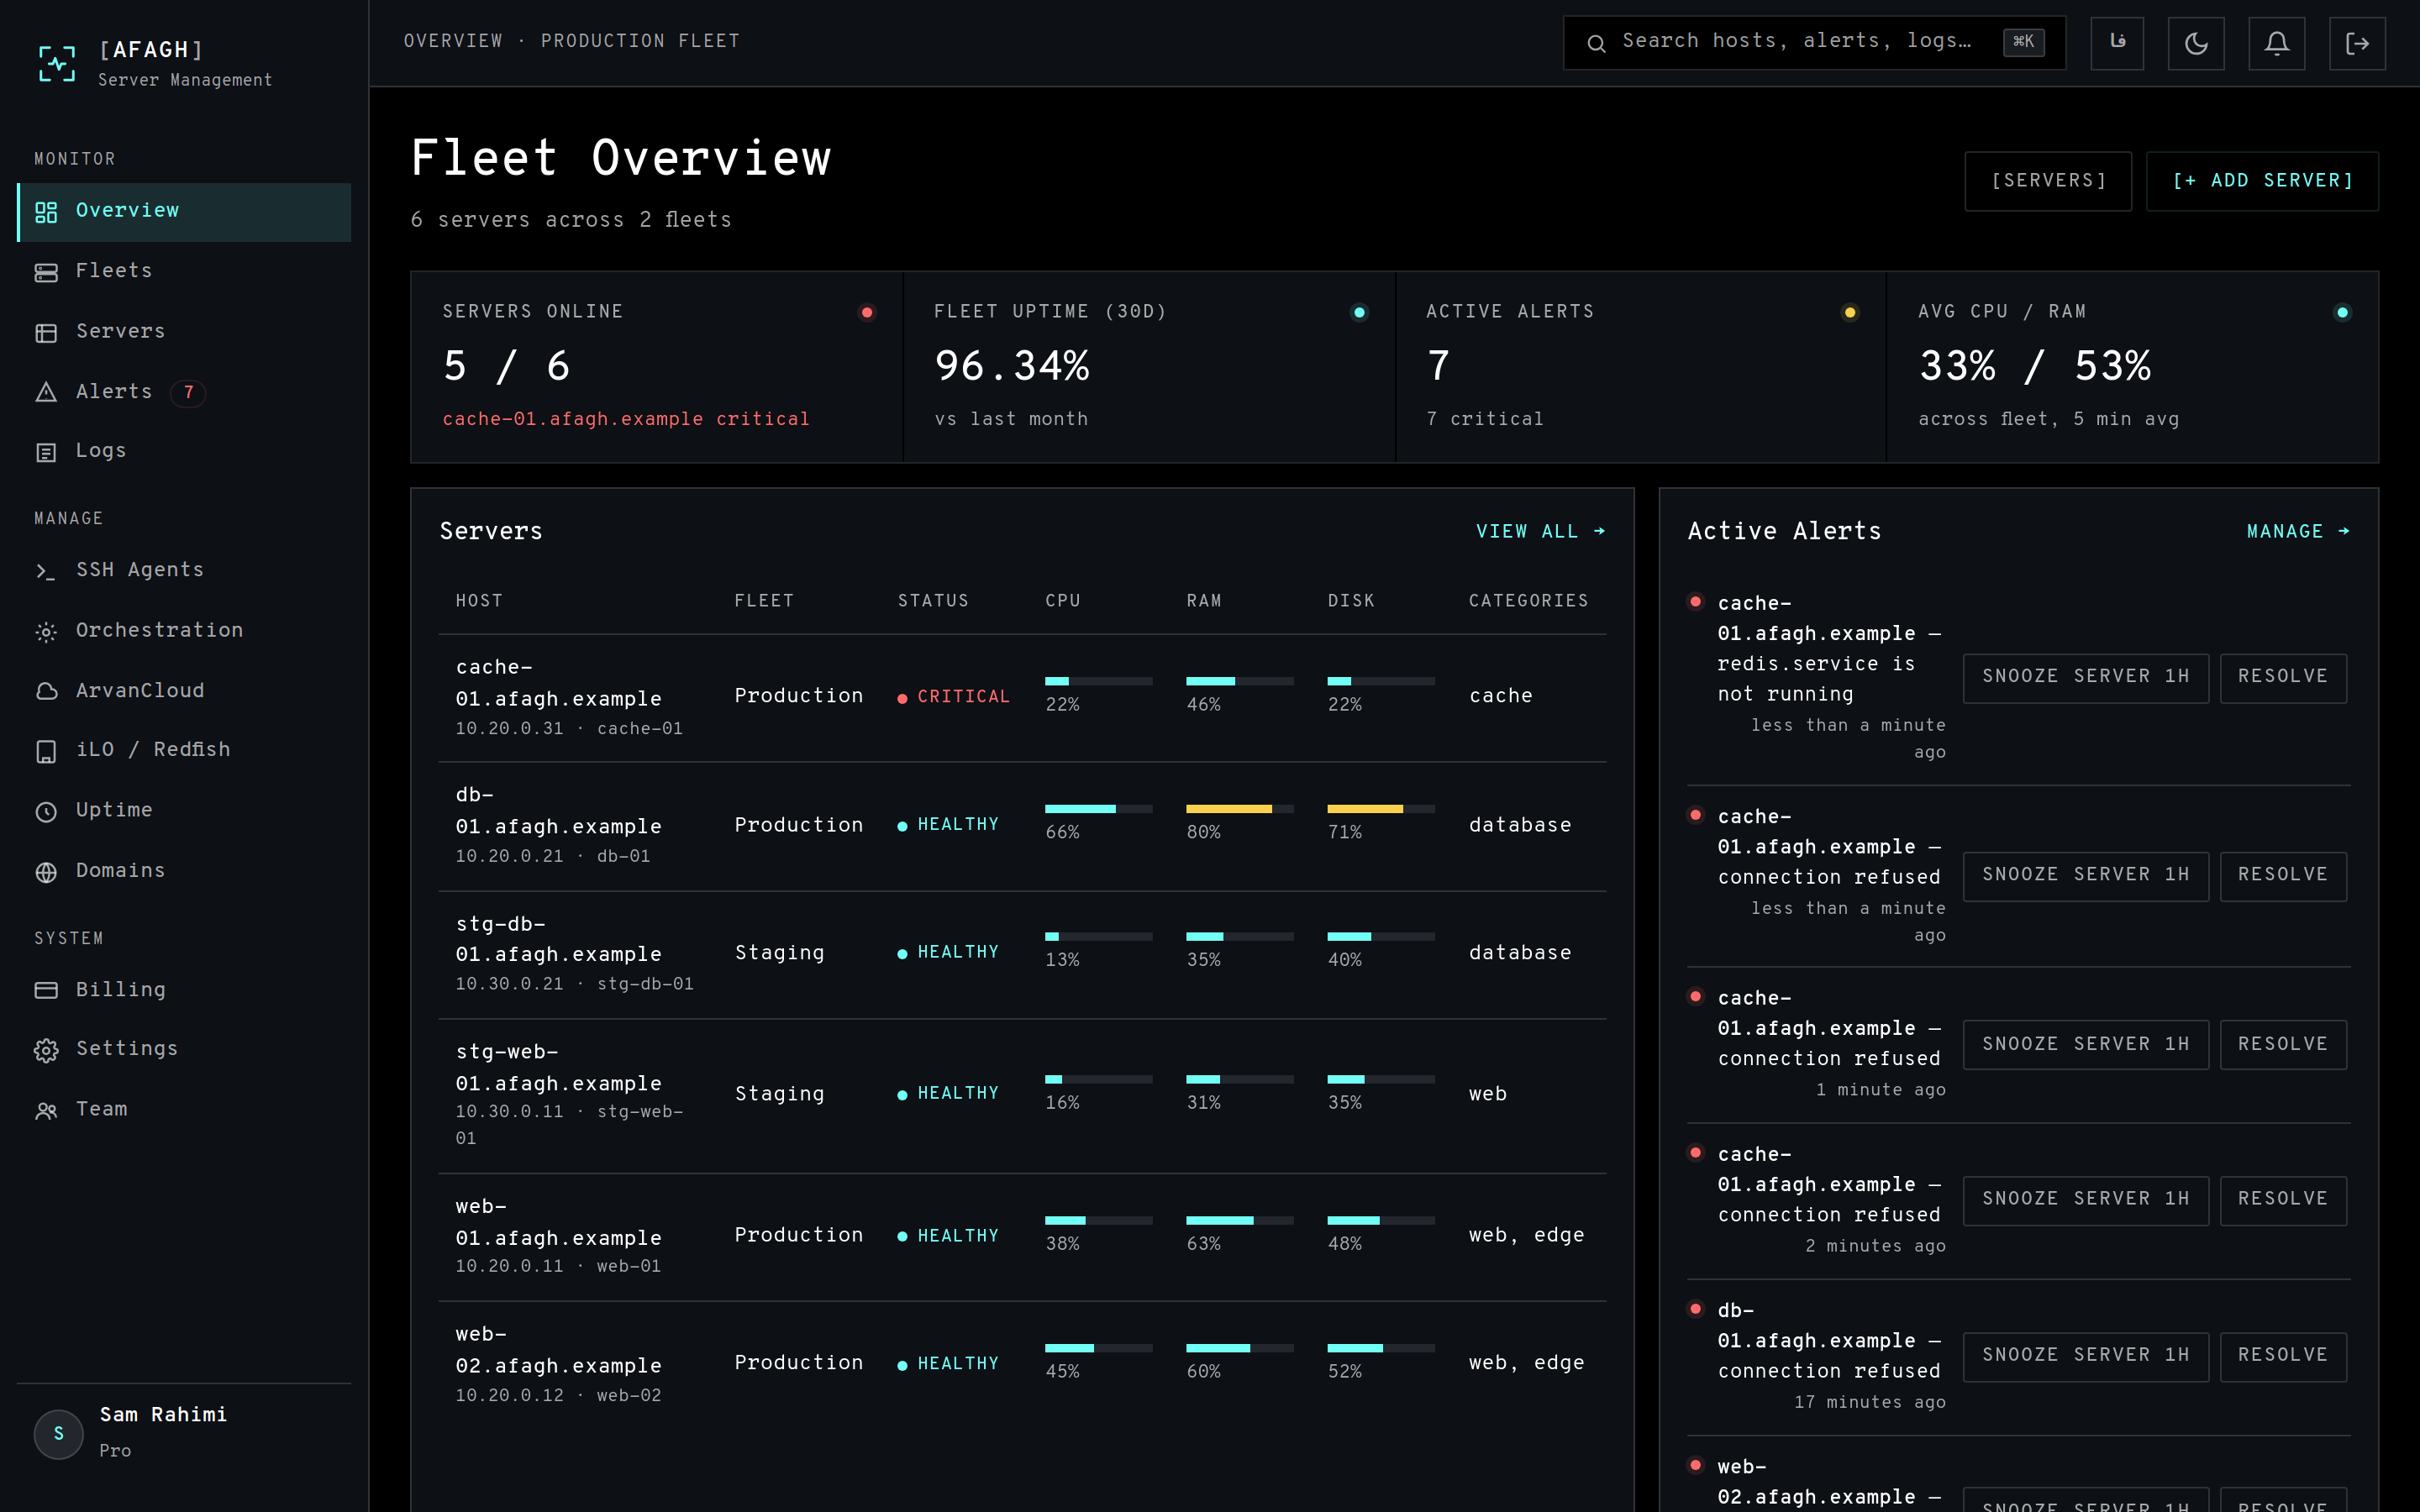
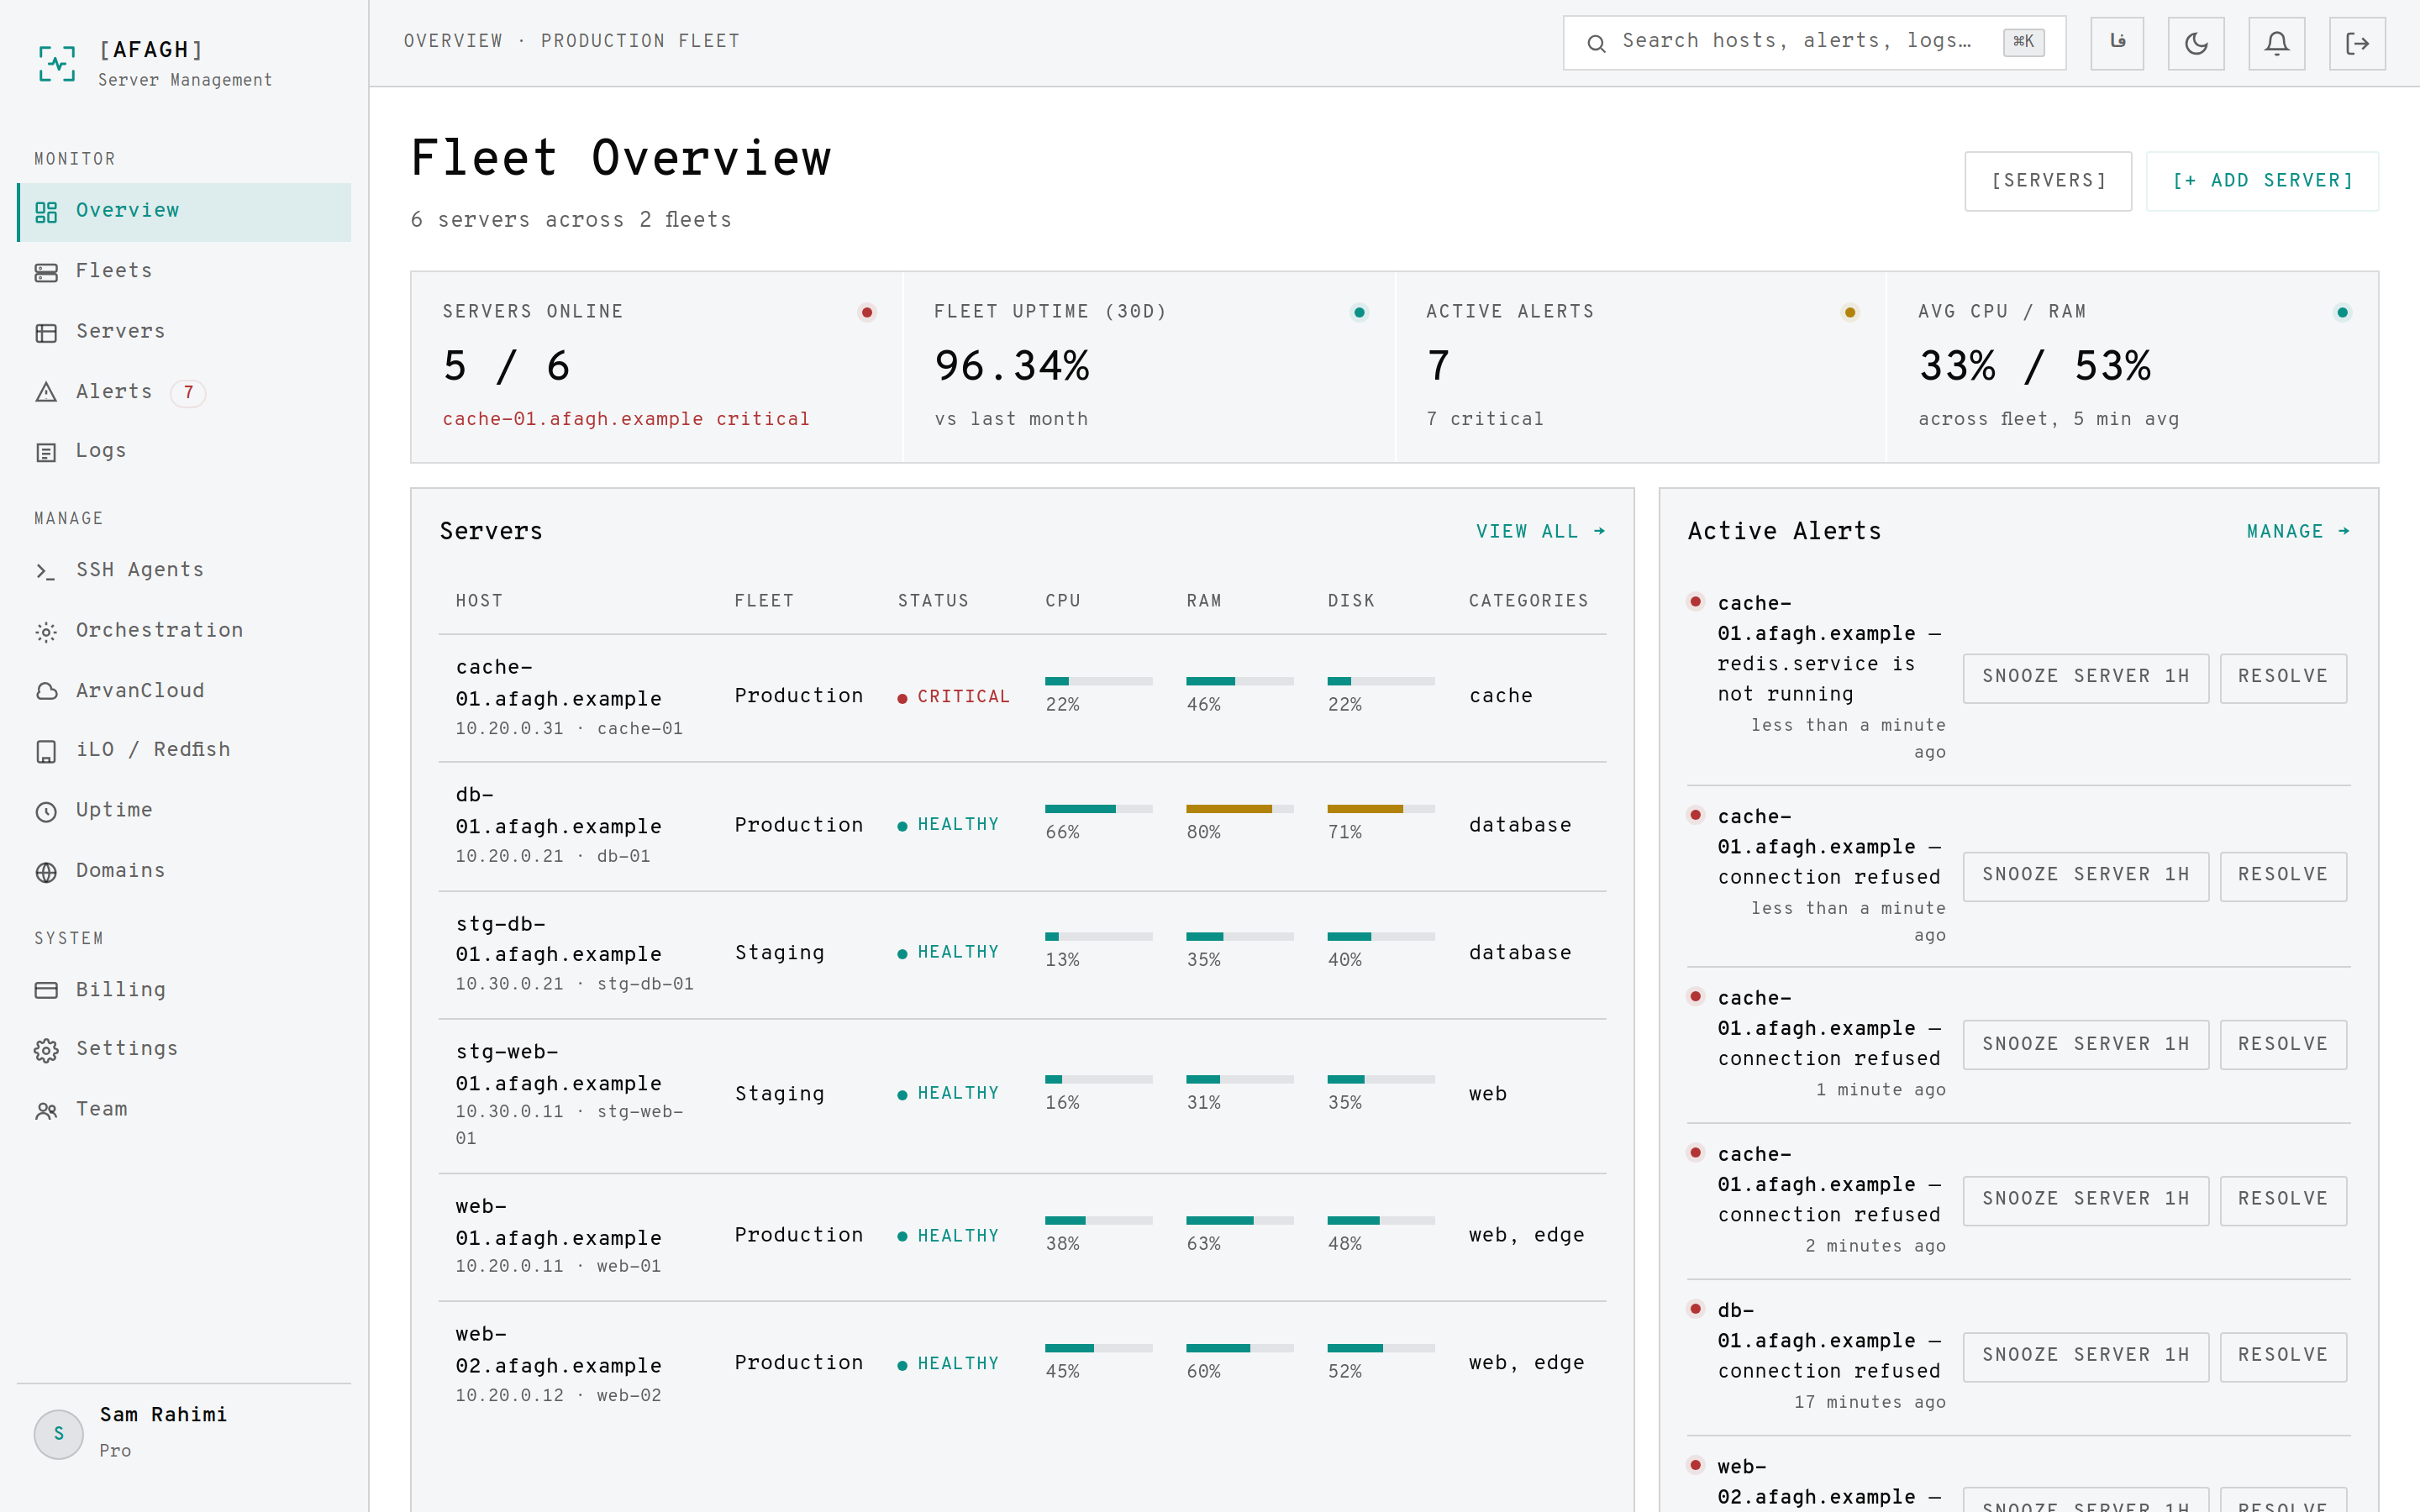
| Panel | What it tells you |
|---|---|
| Servers online | How many servers are not critical or unknown, out of the total. Names the critical one. |
| Fleet uptime (30d) | Share of uptime checks that passed over the last 30 days. |
| Active alerts | Open alerts across the account, and how many are critical. |
| Avg CPU / RAM | Mean load across every reporting server. |
| Servers table | Per-server status with CPU, RAM and disk meters. Click a row to open it. |
| Active alerts list | The newest alerts, each with snooze and resolve. |
| Uptime checks | Recent checks with their pass/fail history, response time and status code. |
Status badges
- Healthy — reporting normally, nothing over threshold.
- Warning — CPU or memory above 85%, or disk above 90%.
- Critical — an uptime check has failed in the last 15 minutes.
- Unknown — no metrics and no checks yet.
A server in detail
A server's page collects everything known about one host, split across tabs: Metrics, Information, Services, Uptime Checks, Logs, Agent and Maintenance.
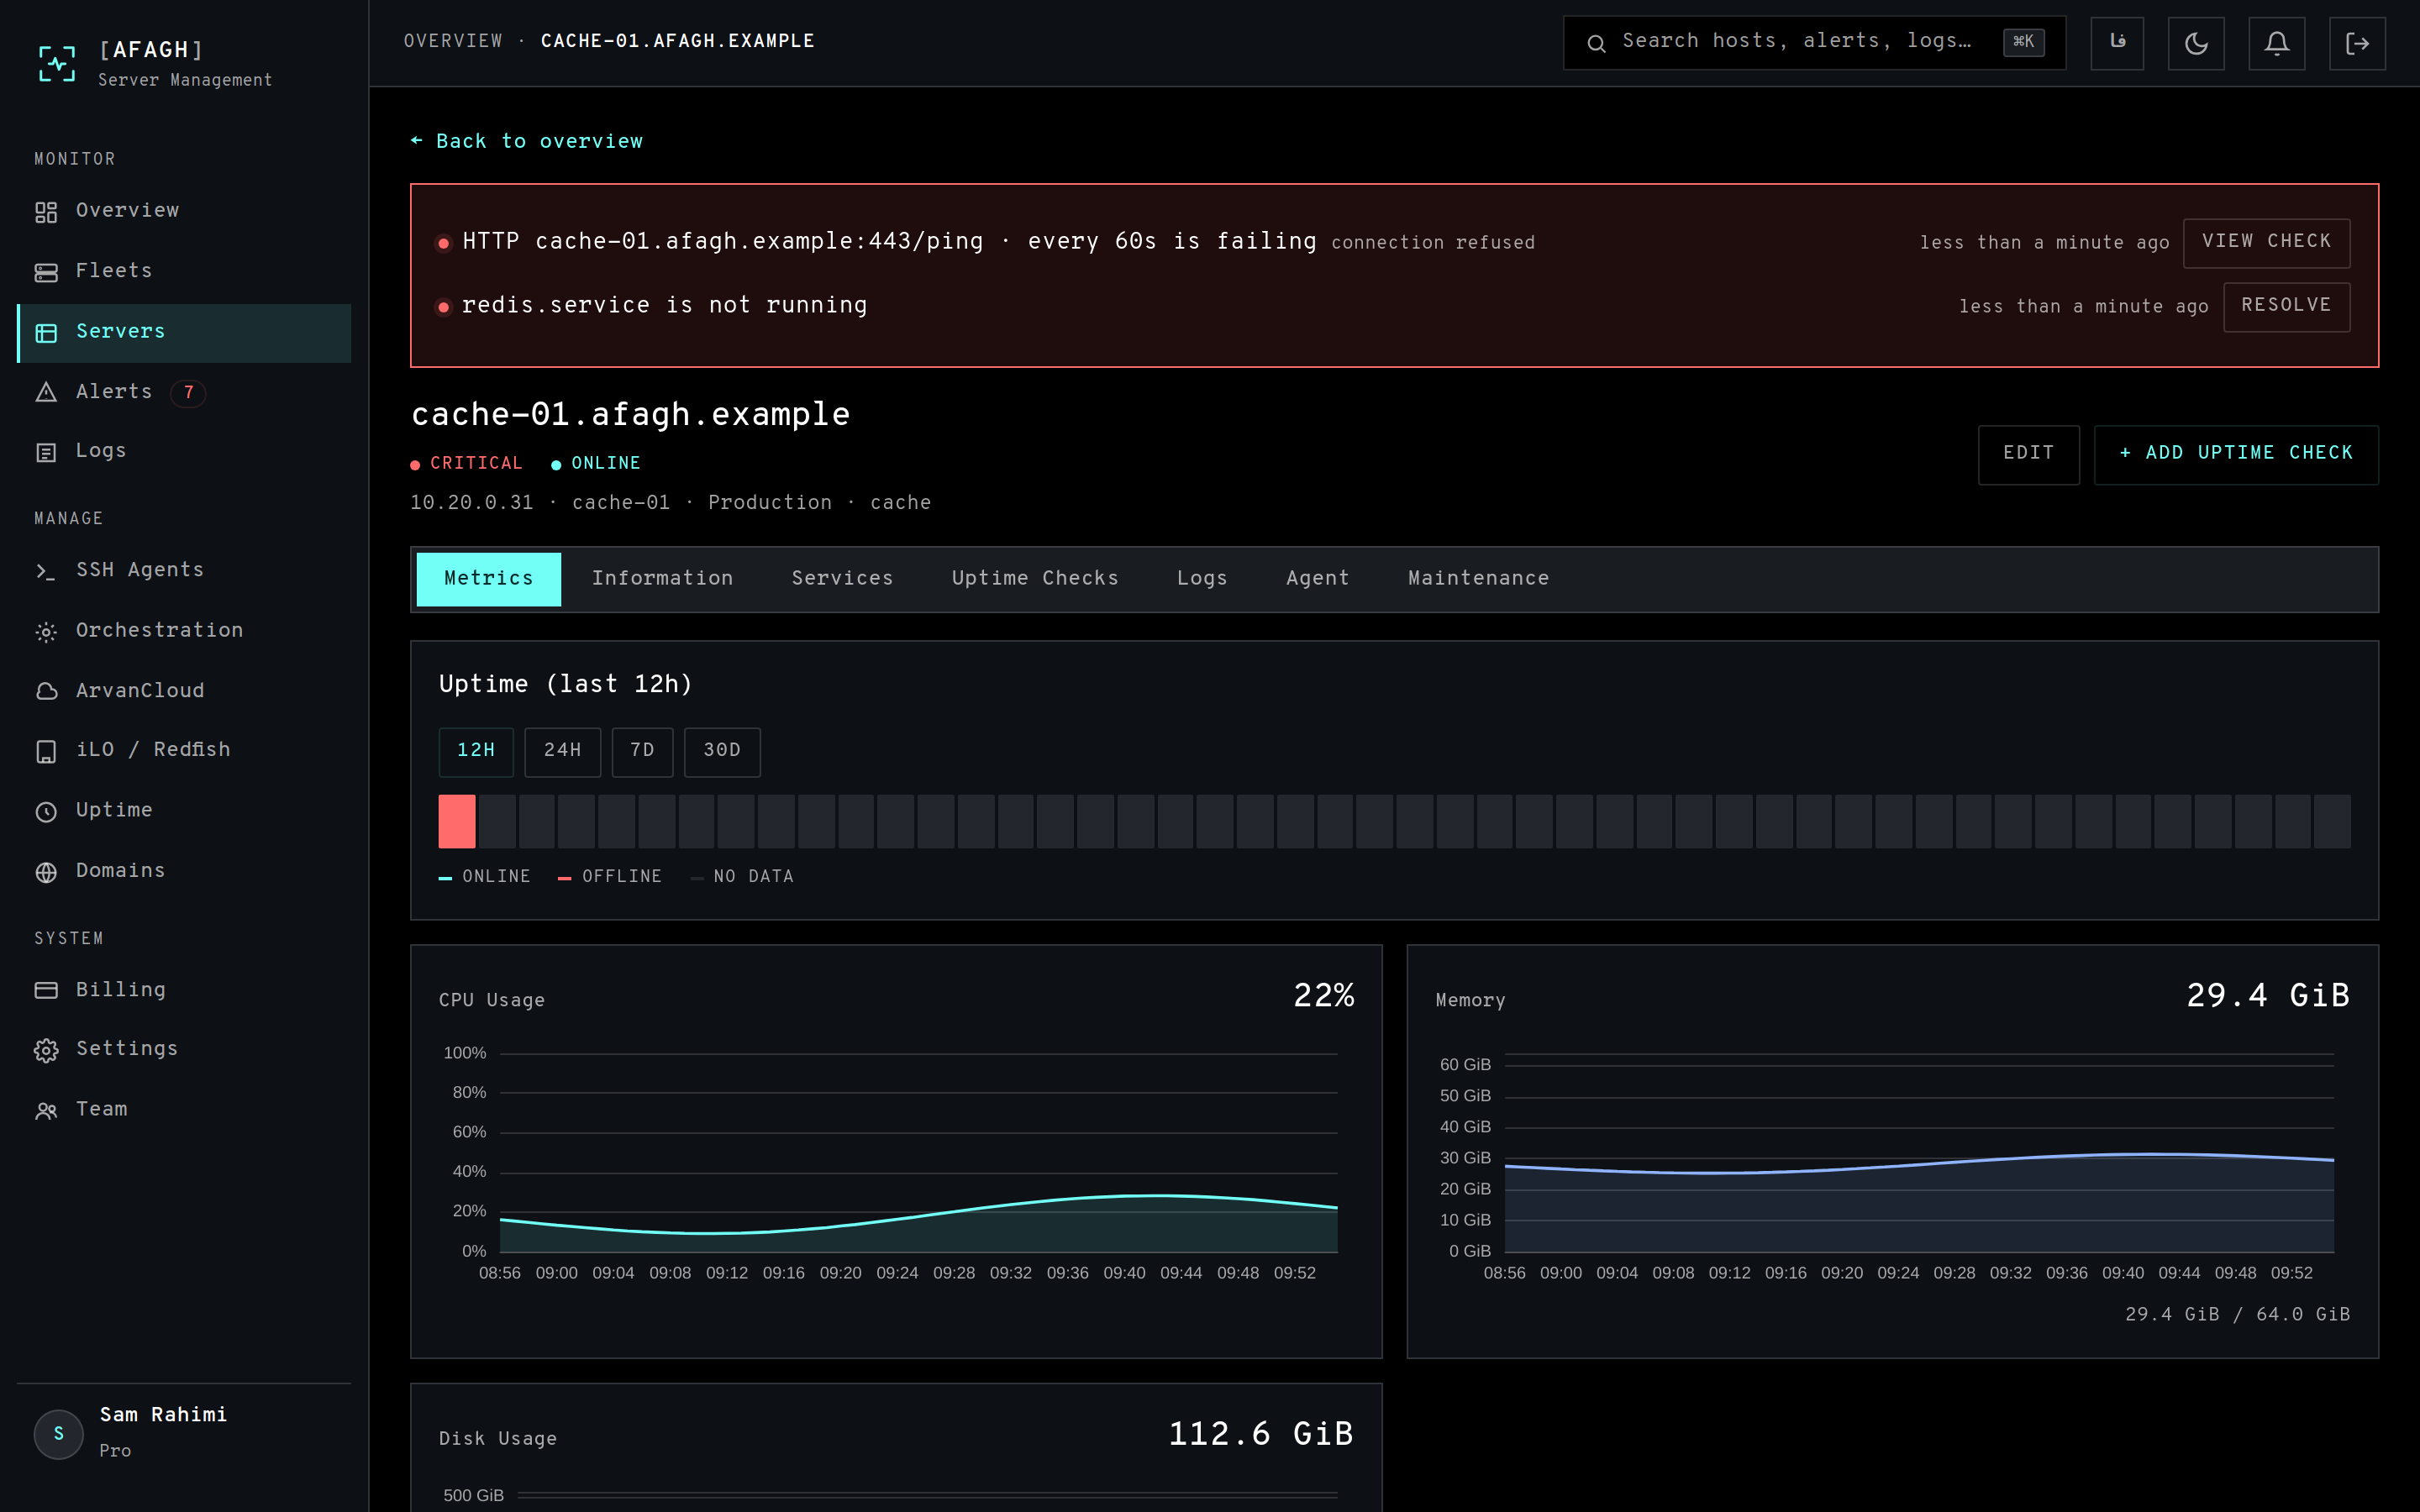
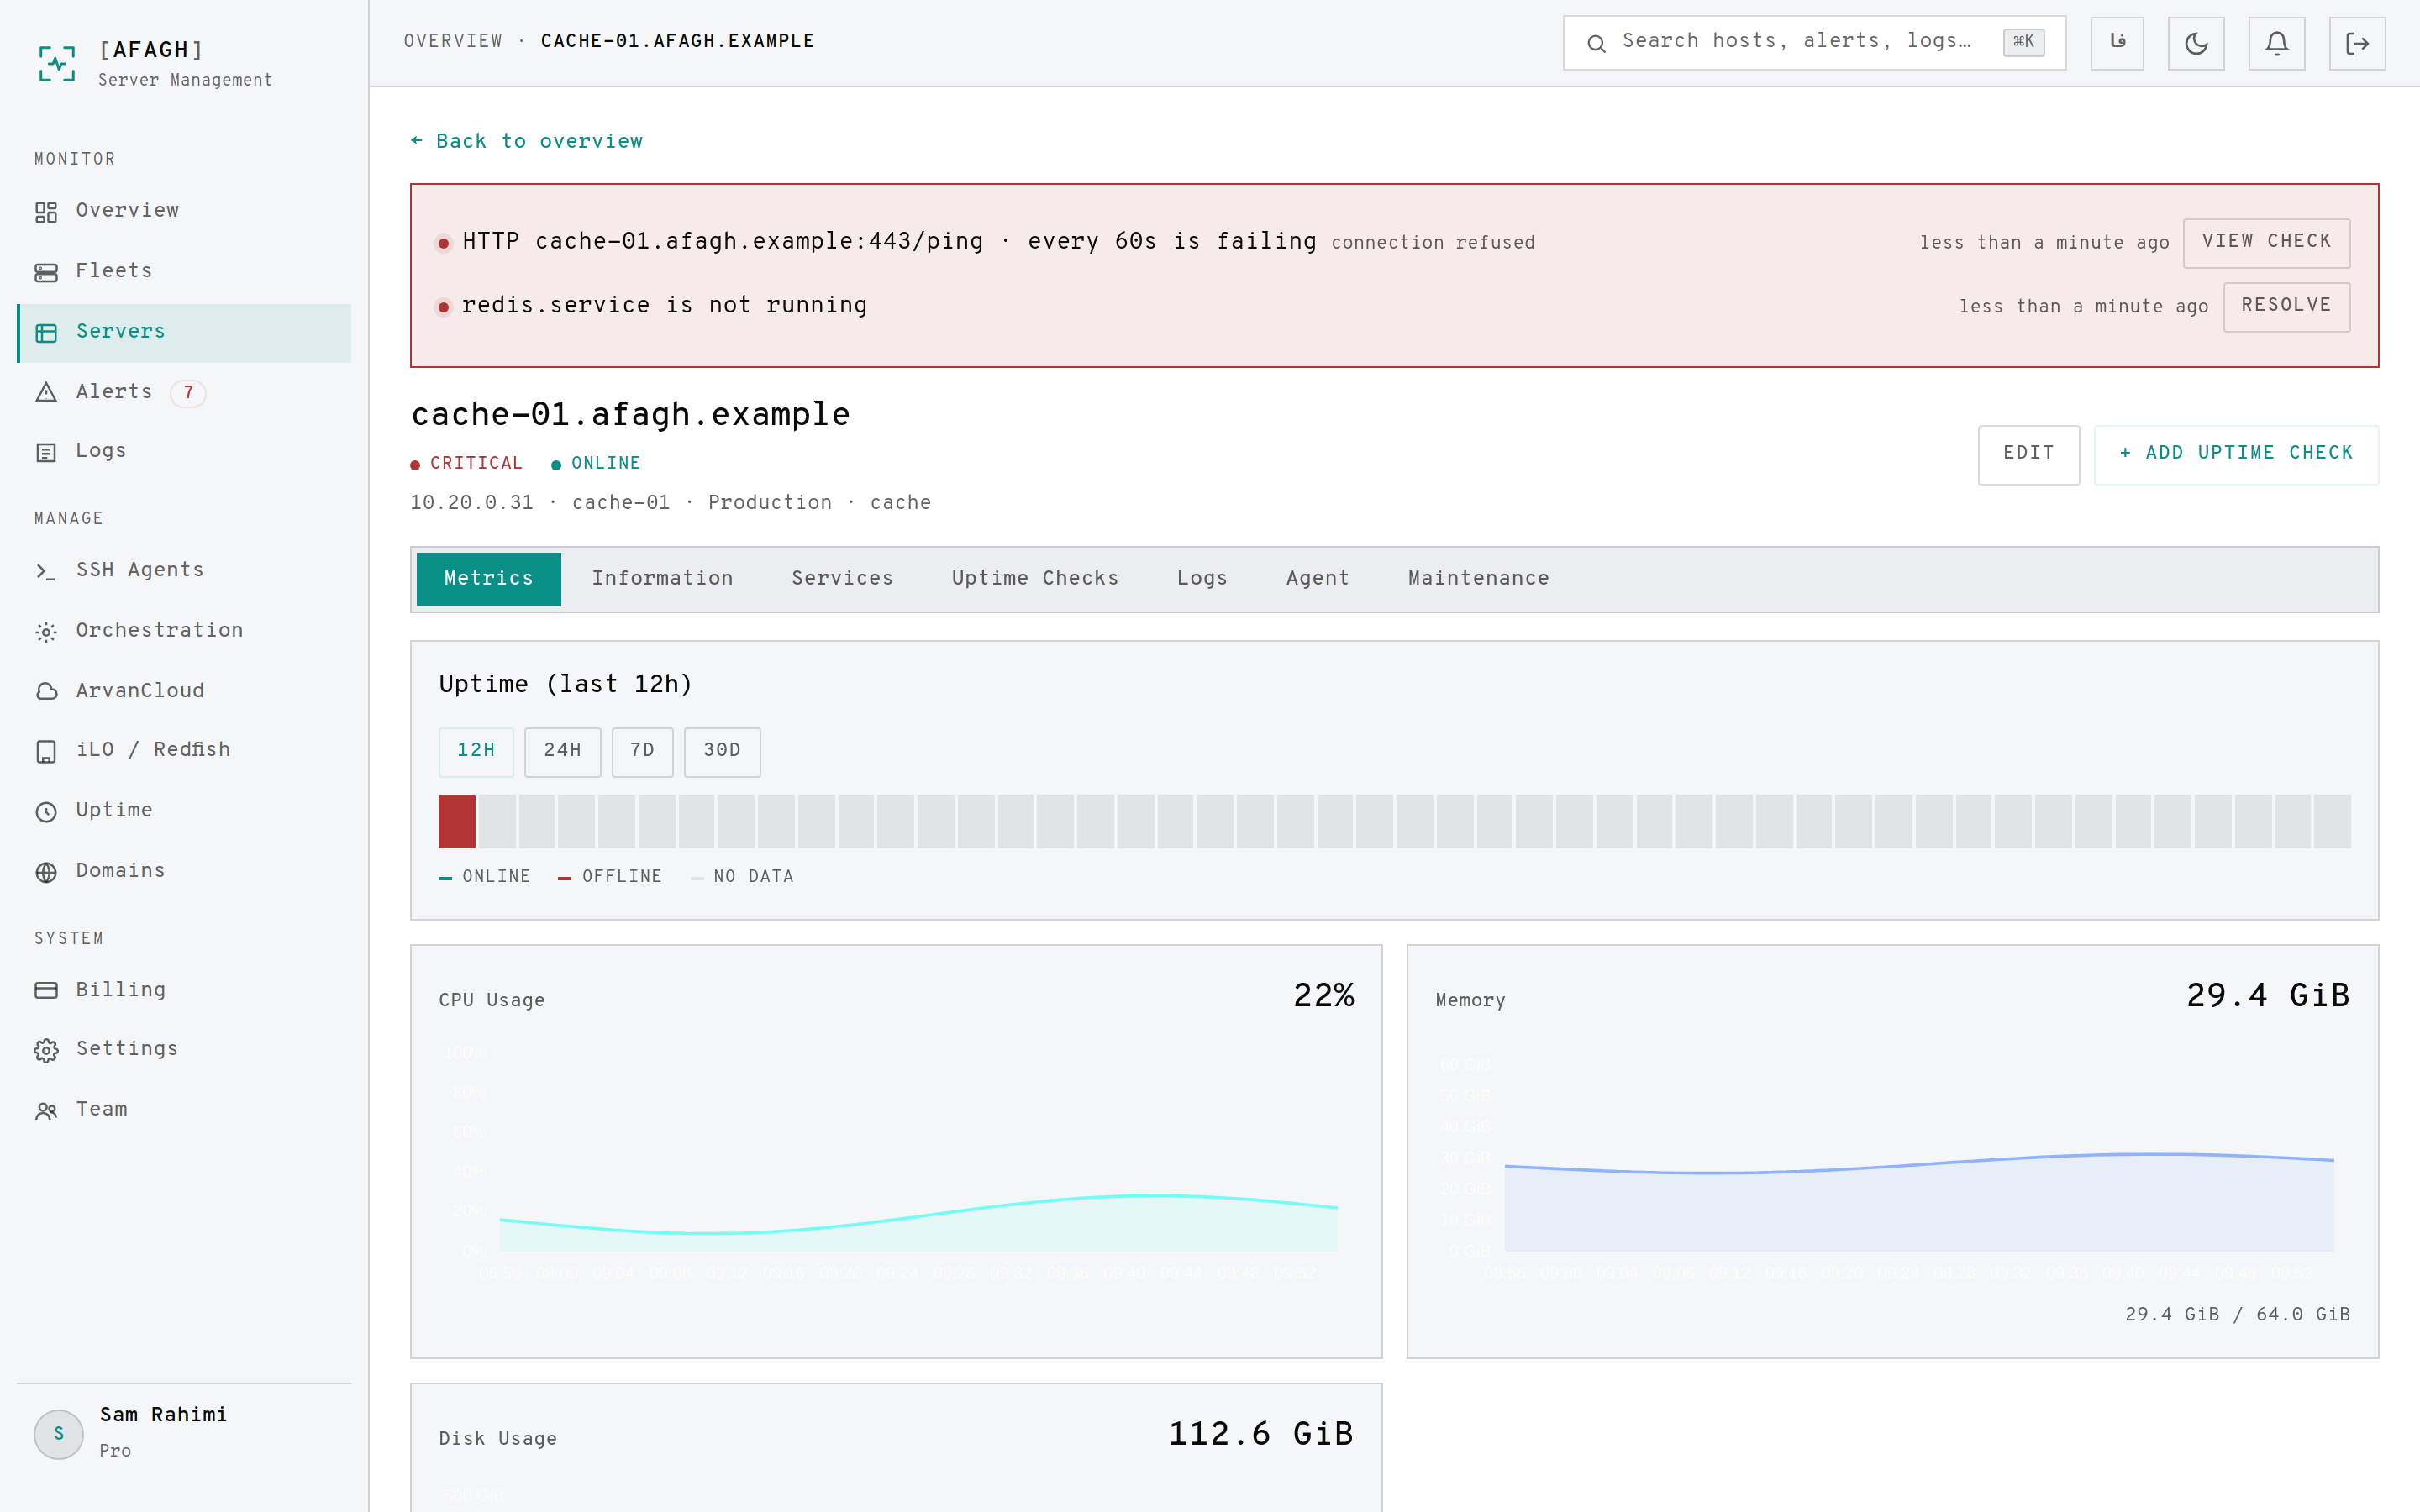
- Metrics — CPU, memory and disk over your chosen window, plus network rates. Memory and disk are shown in real units against the machine's totals.
- Uptime strip — online/offline history, switchable between 12h, 24h, 7d and 30d.
- Information — hardware inventory reported by the agent: CPU model, cores, memory, OS.
- Logs — recent journal lines shipped by the agent.
- Maintenance — open a maintenance window to mute this server while you work on it.
Disk runway
Afagh fits a line through the last week of hourly disk usage and projects when the volume would reach 100%. You get a warning while there is still time to act, rather than an alert once it is already full.
Uptime checks
An uptime check probes something that should always answer, on an interval you choose. Three kinds are available:
| Type | Use it for | Records |
|---|---|---|
| HTTP / HTTPS | Web endpoints and health URLs | Status code, response time, TLS expiry |
| TCP | Databases, brokers, any open port | Connect time, connection errors |
| Ping | Basic reachability | Round-trip time, packet loss |
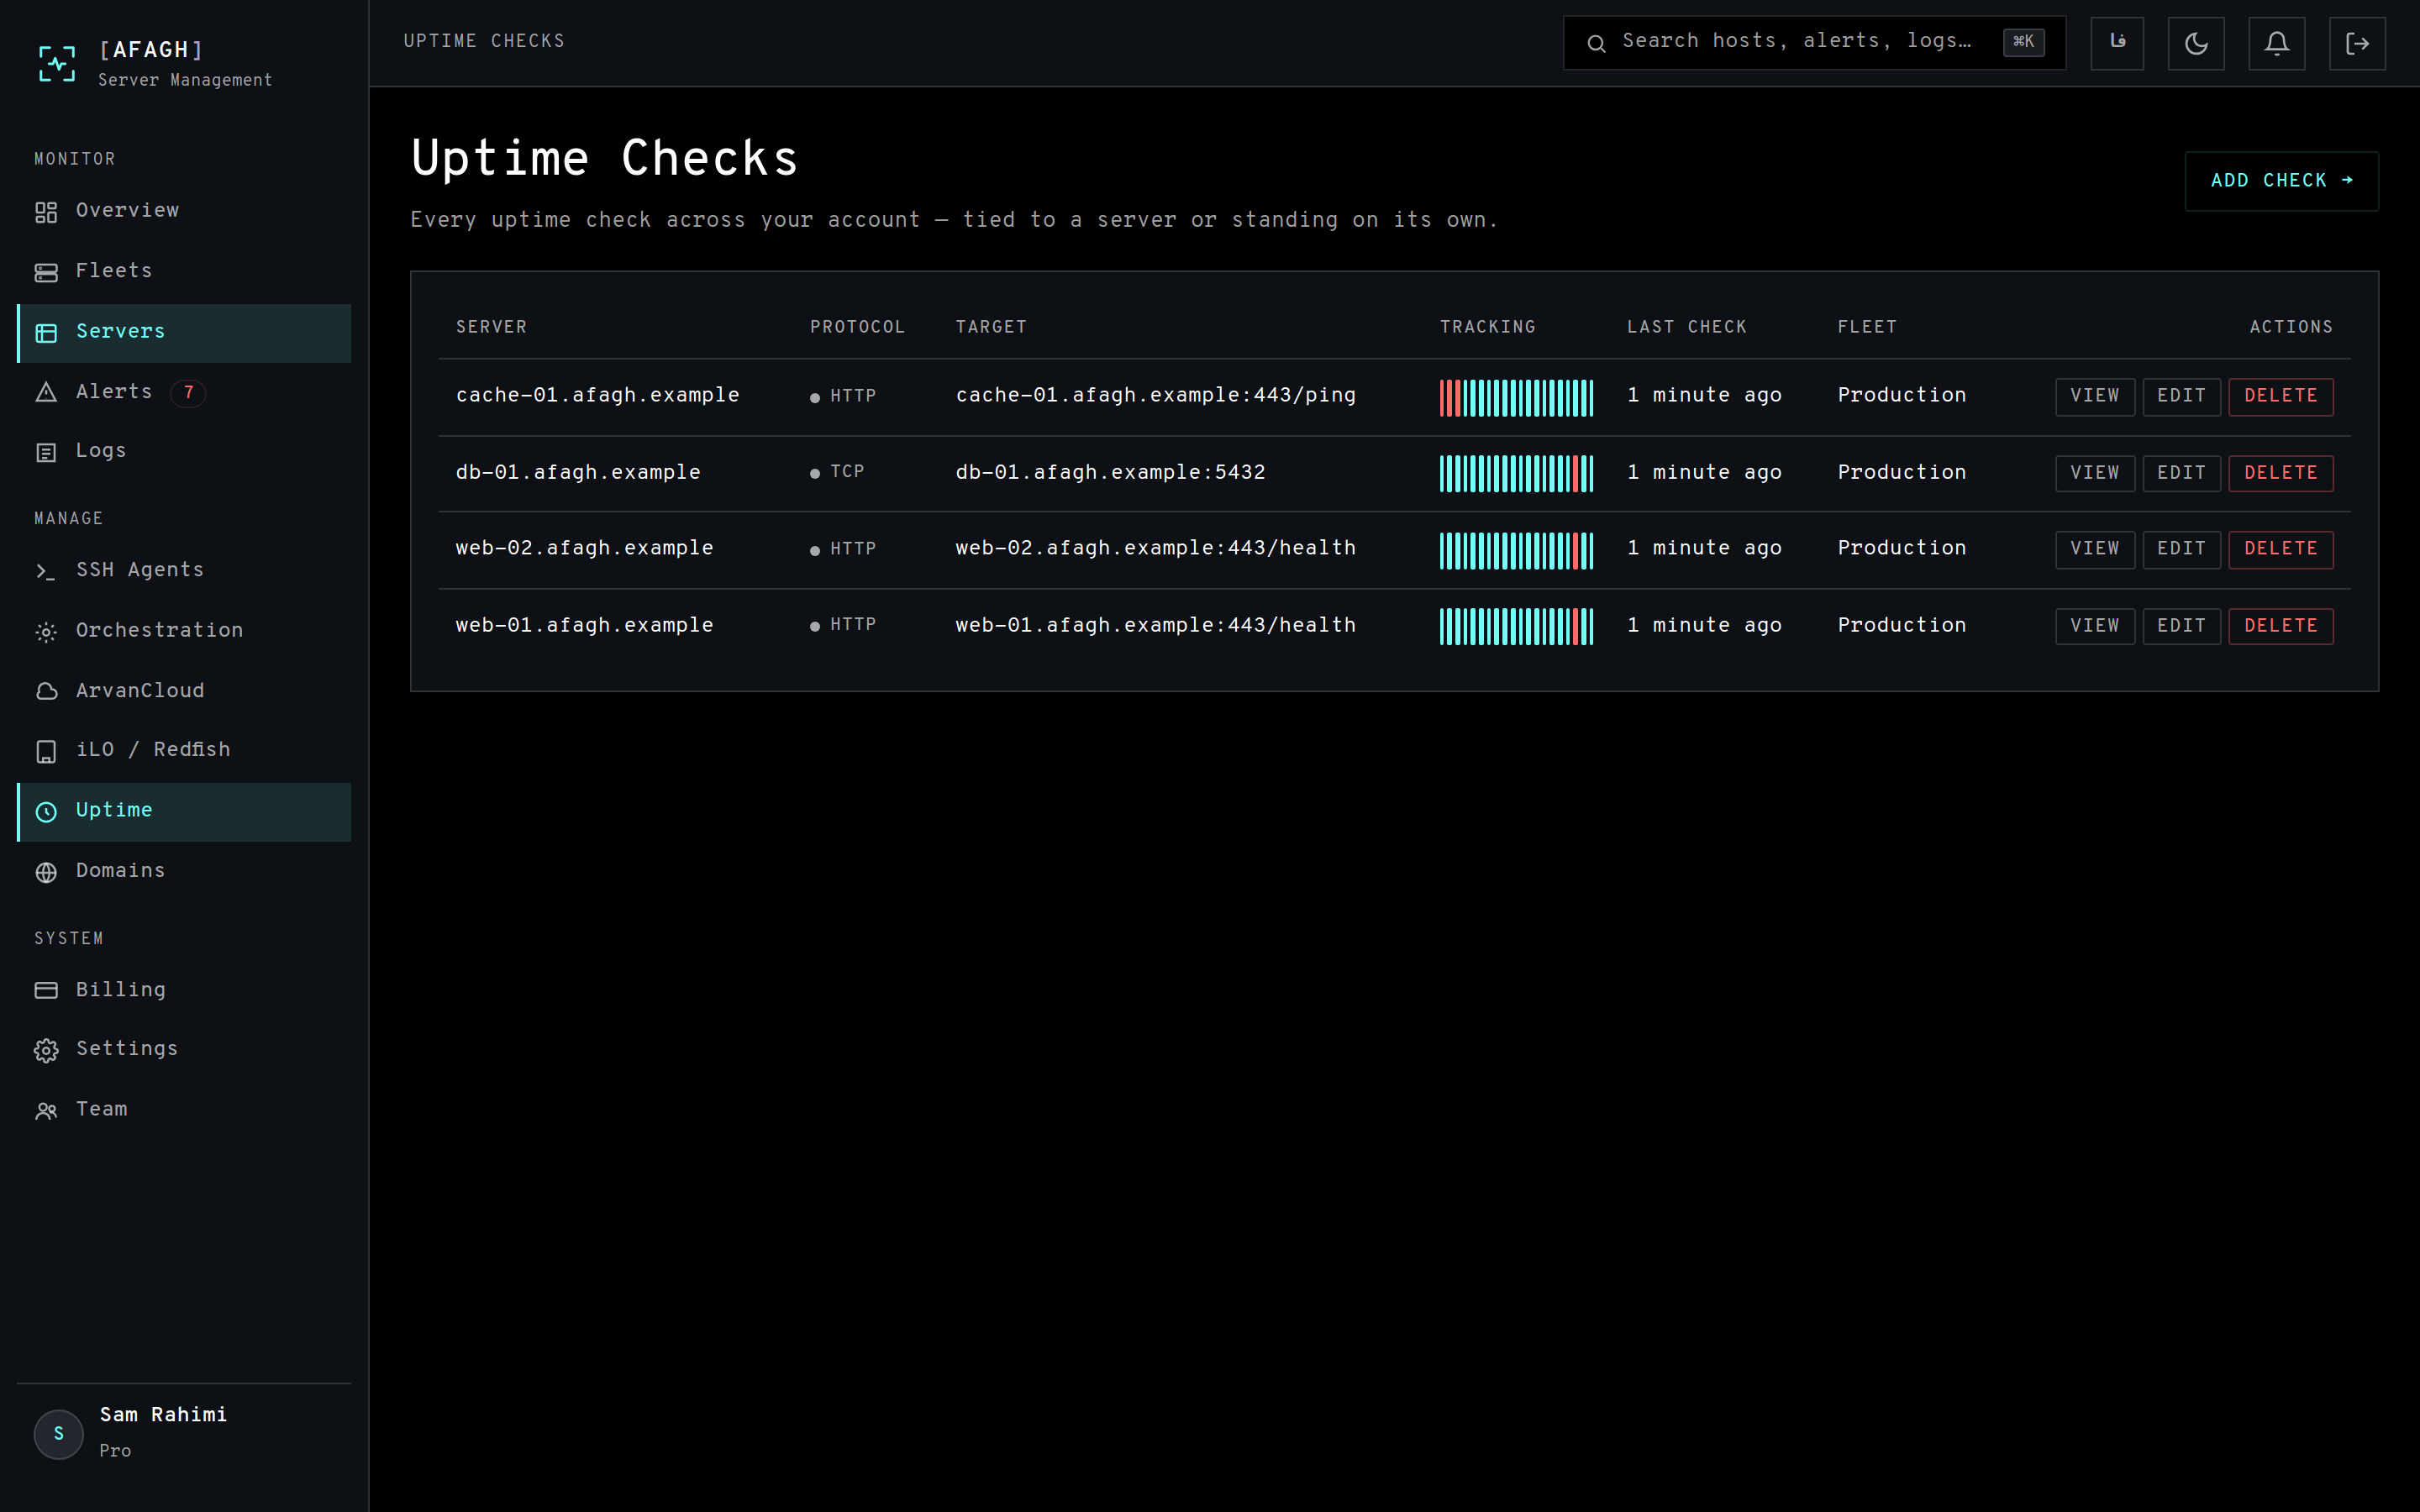
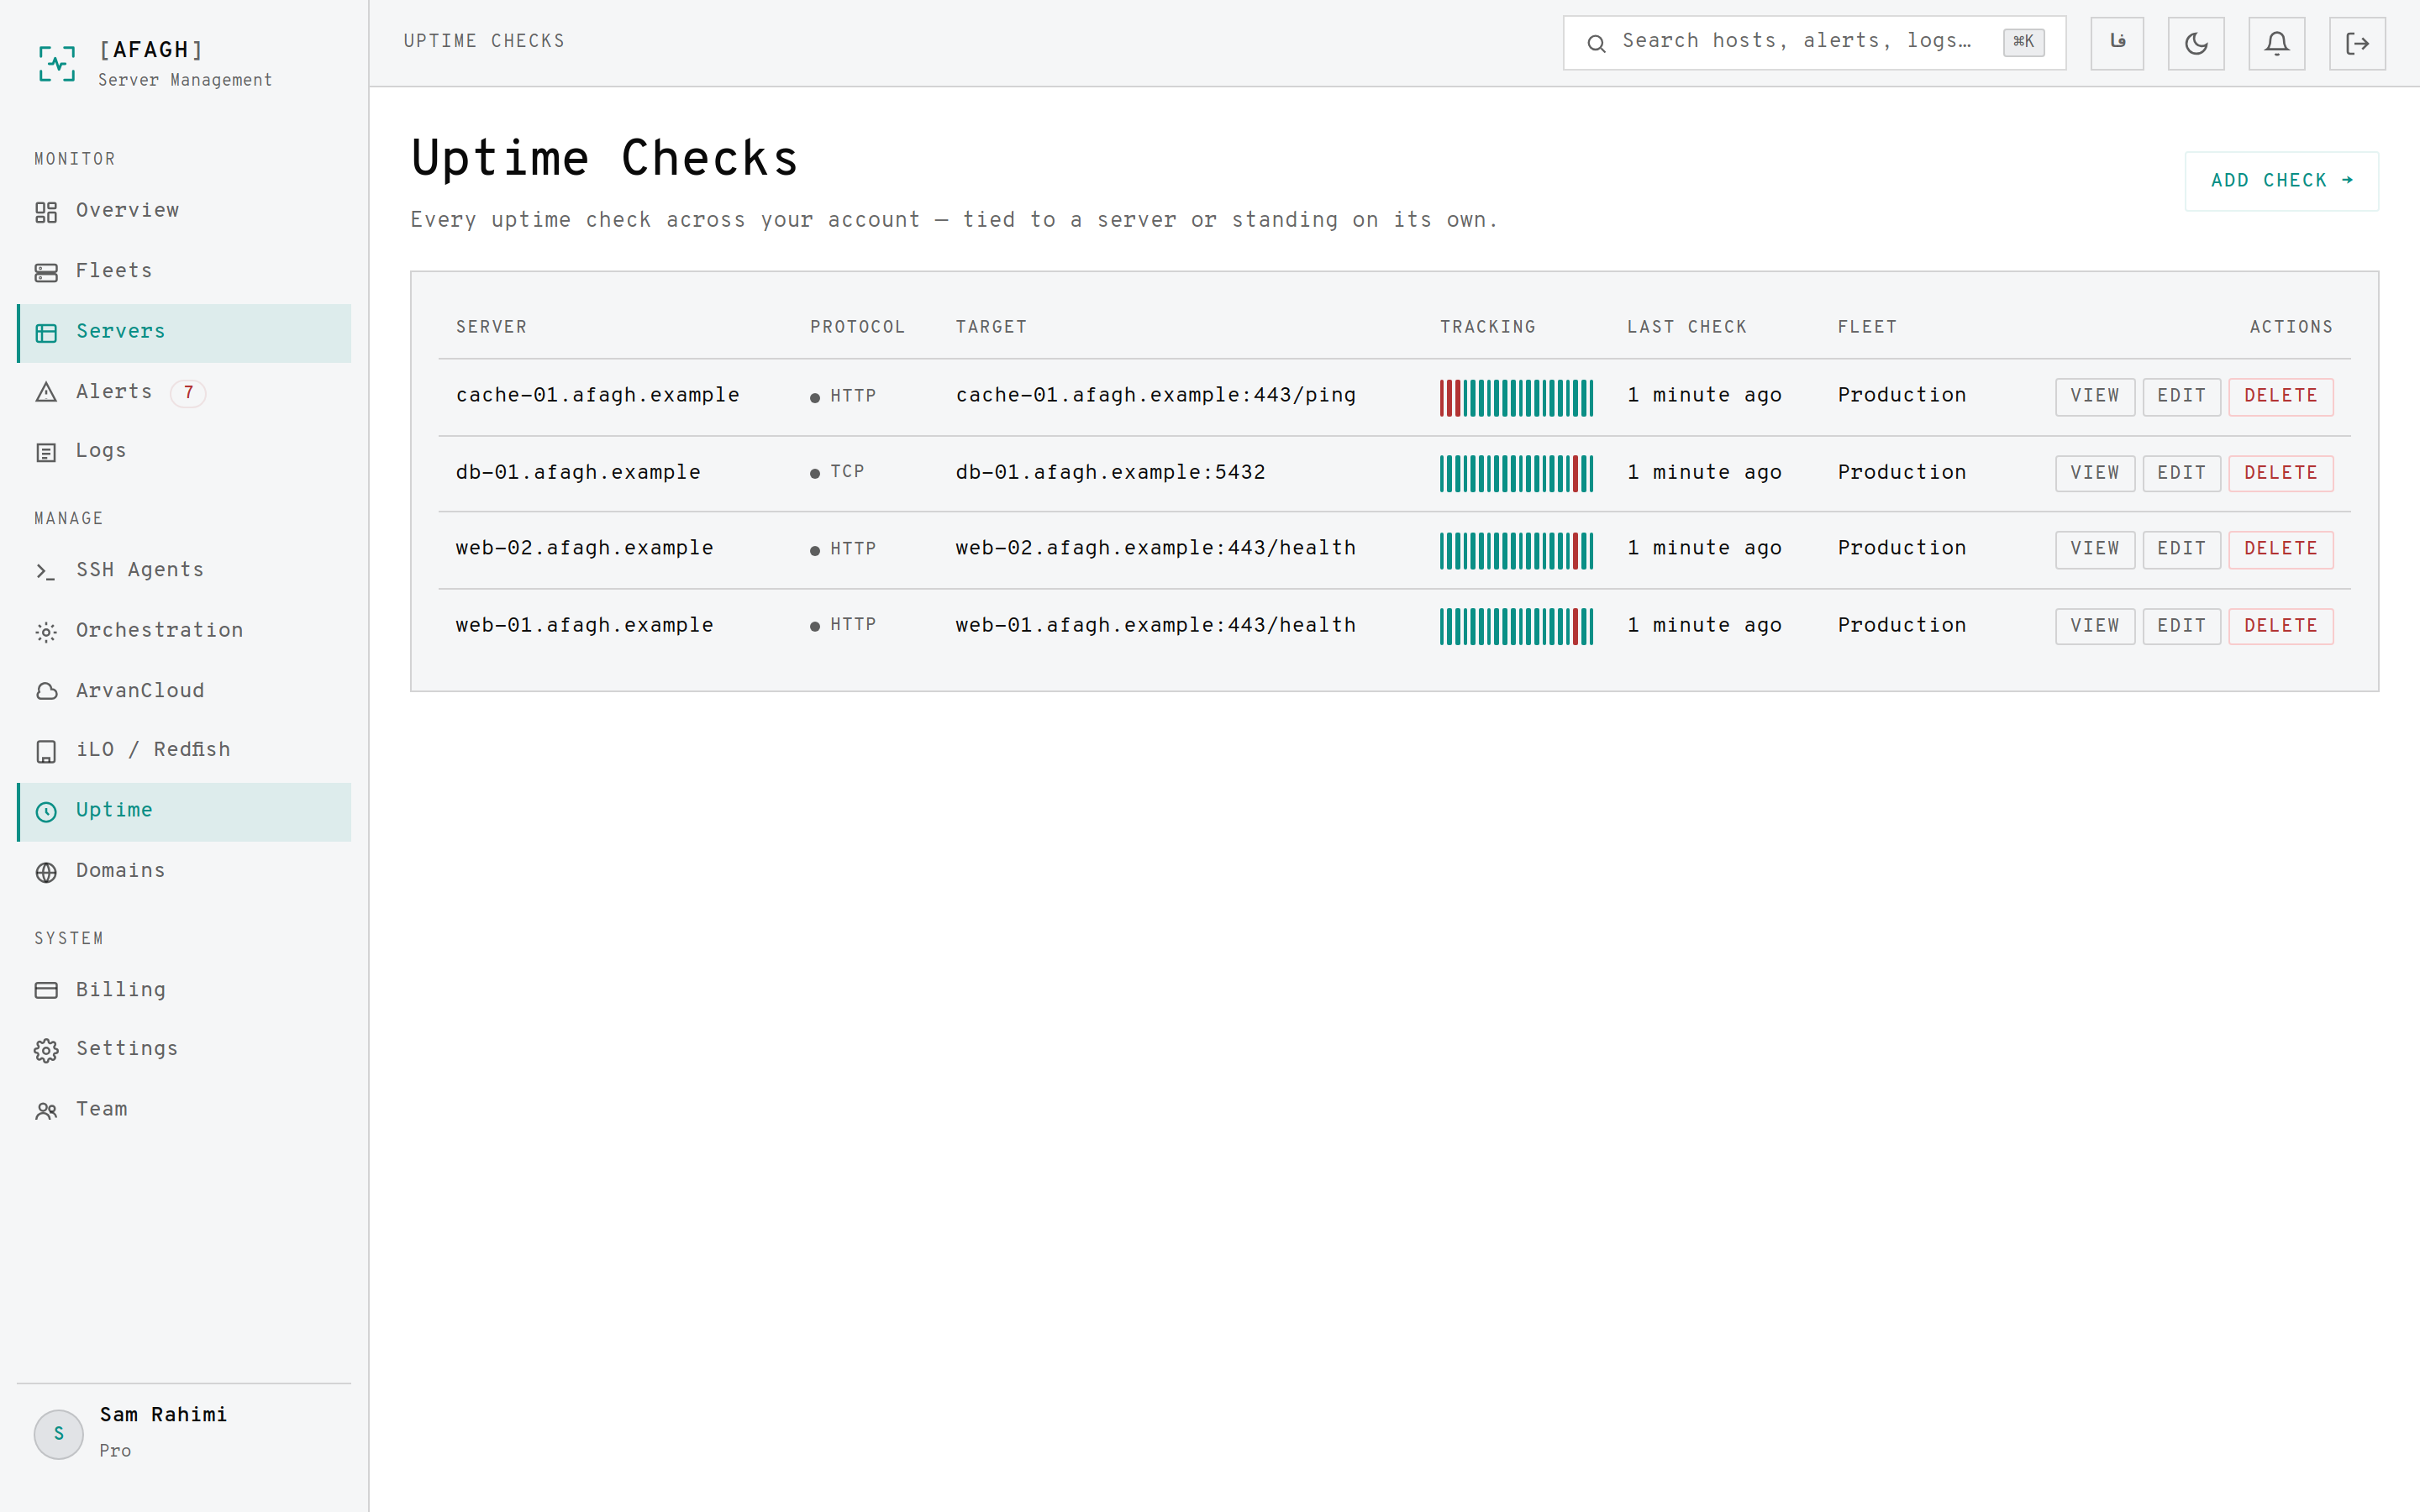
Every probe records its response time, status code and any error. History is rolled up hourly, which is what keeps the 30-day views fast to draw. For HTTPS checks Afagh also tracks the certificate's expiry date and flags it before it becomes a problem.
Set the interval and timeout to match how sensitive you want the check to be. A 60-second interval with a 5-second timeout is a reasonable default for a web endpoint.
Alerts & notifications
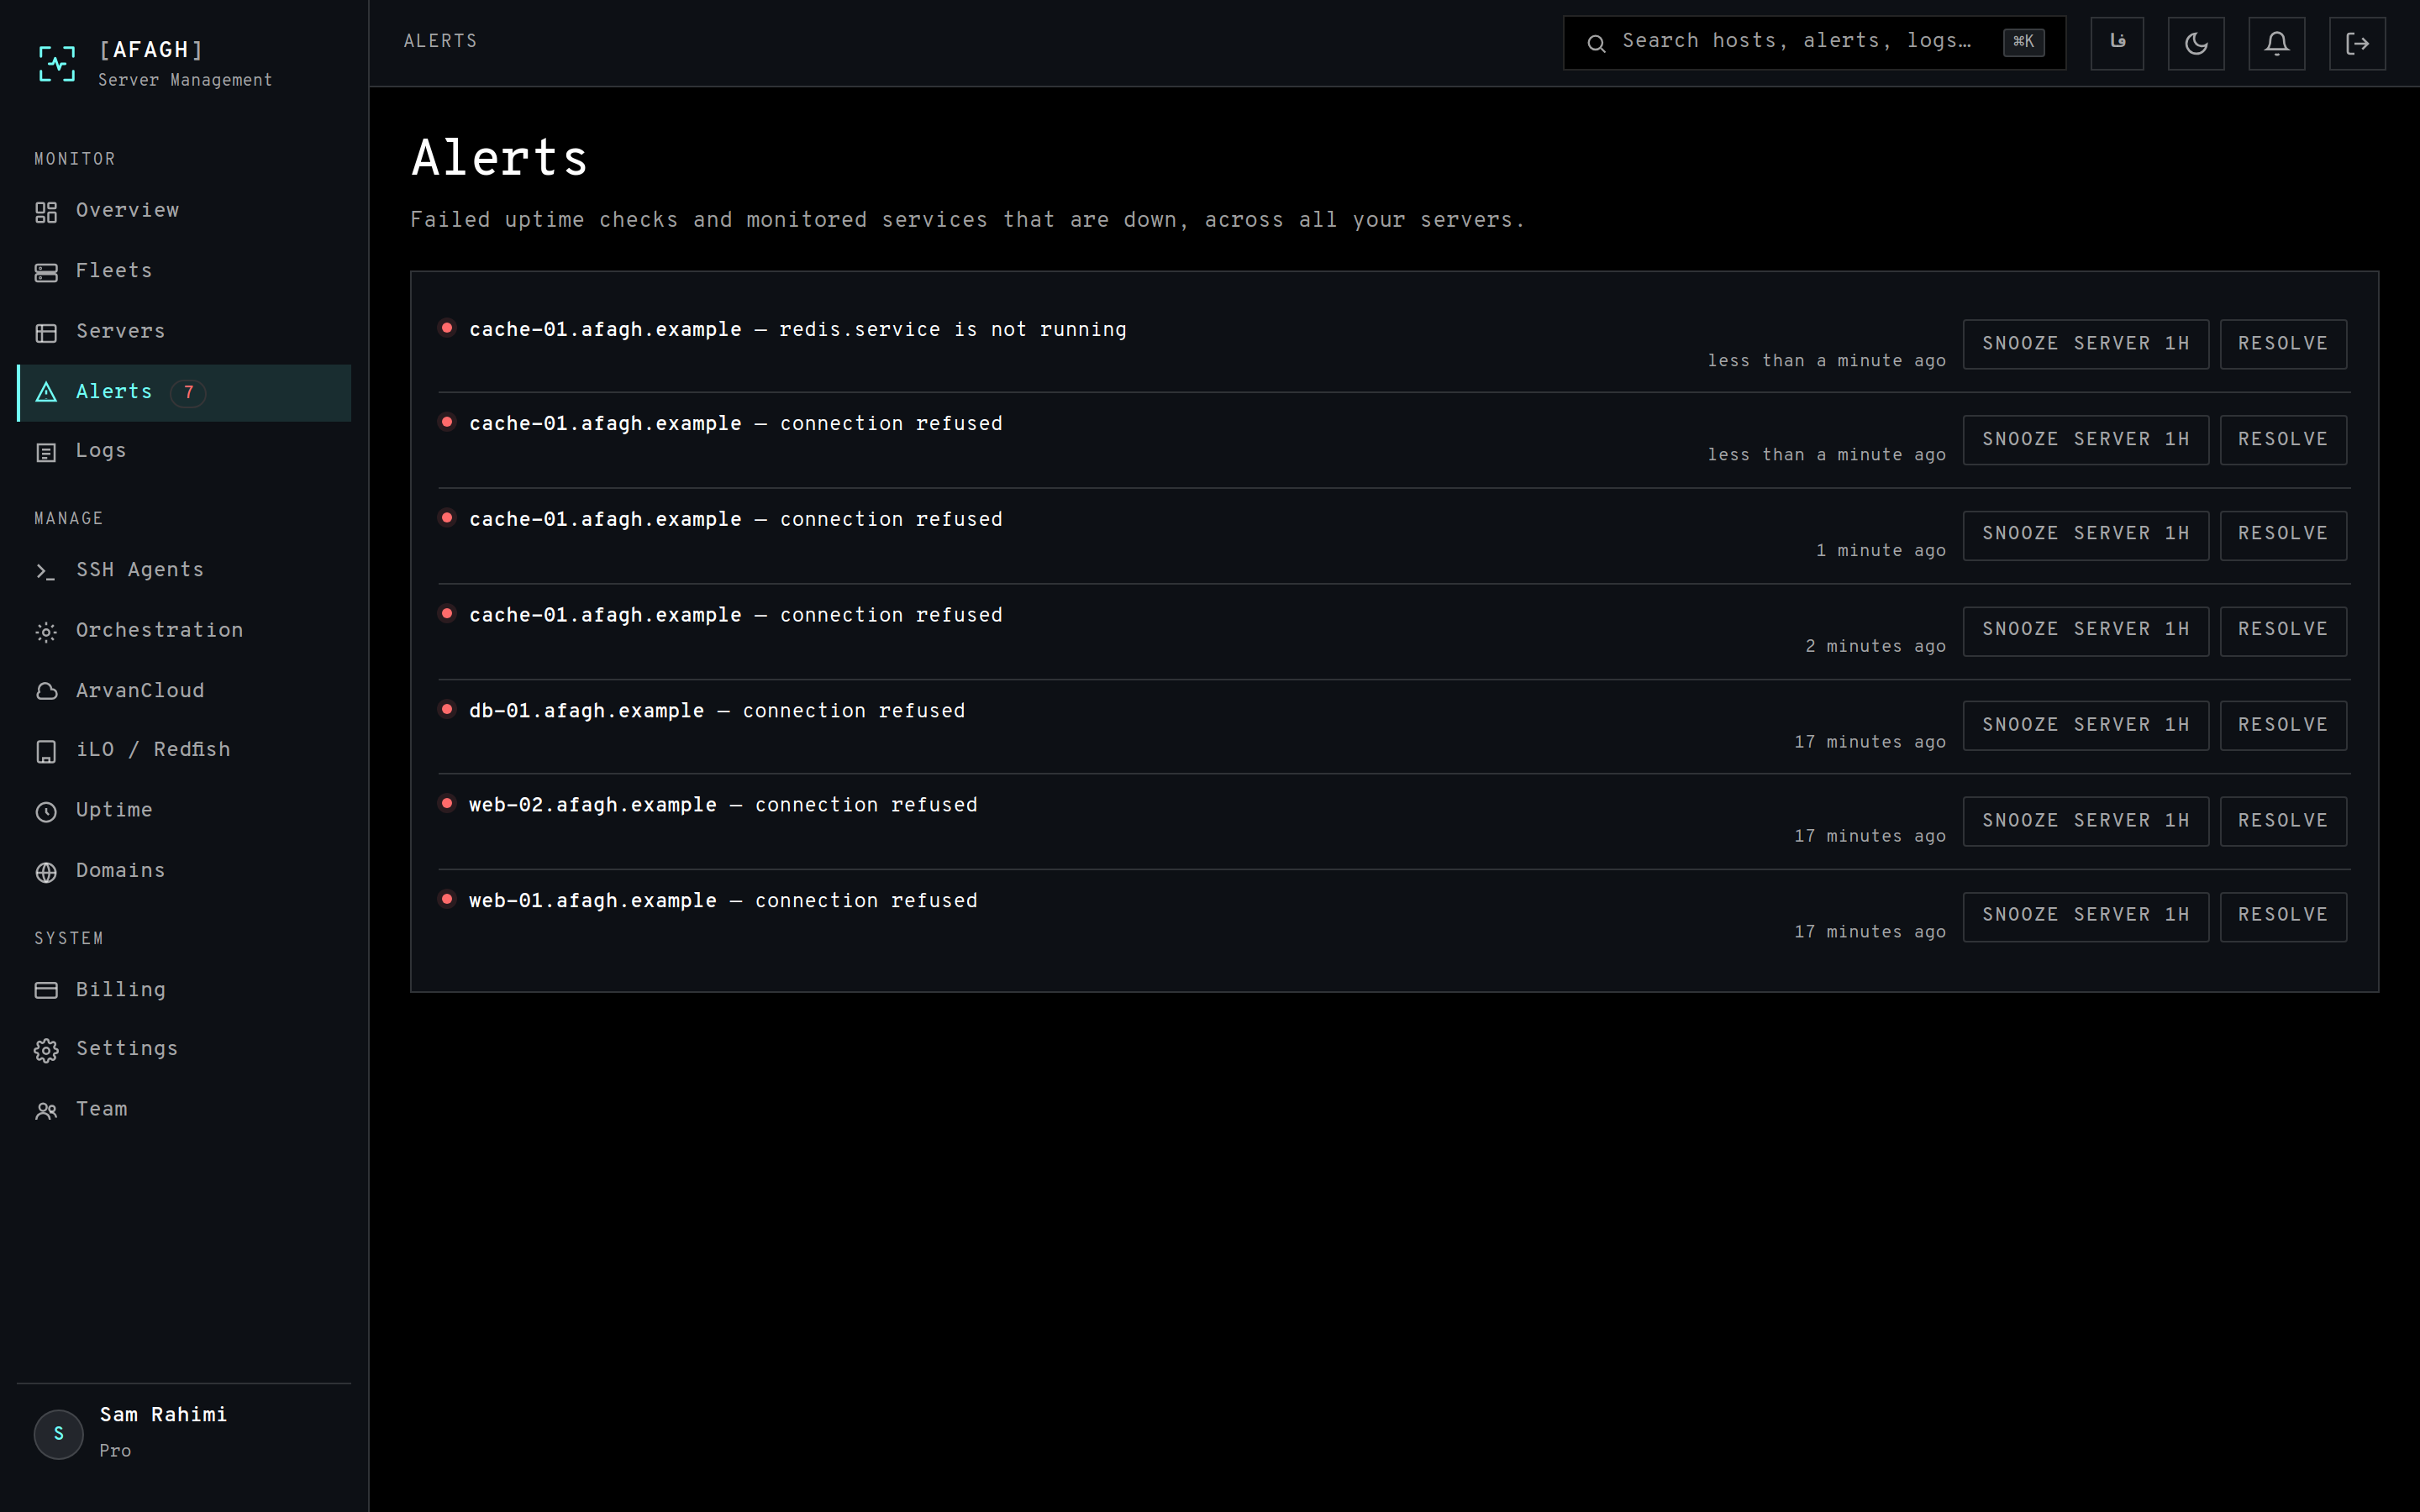
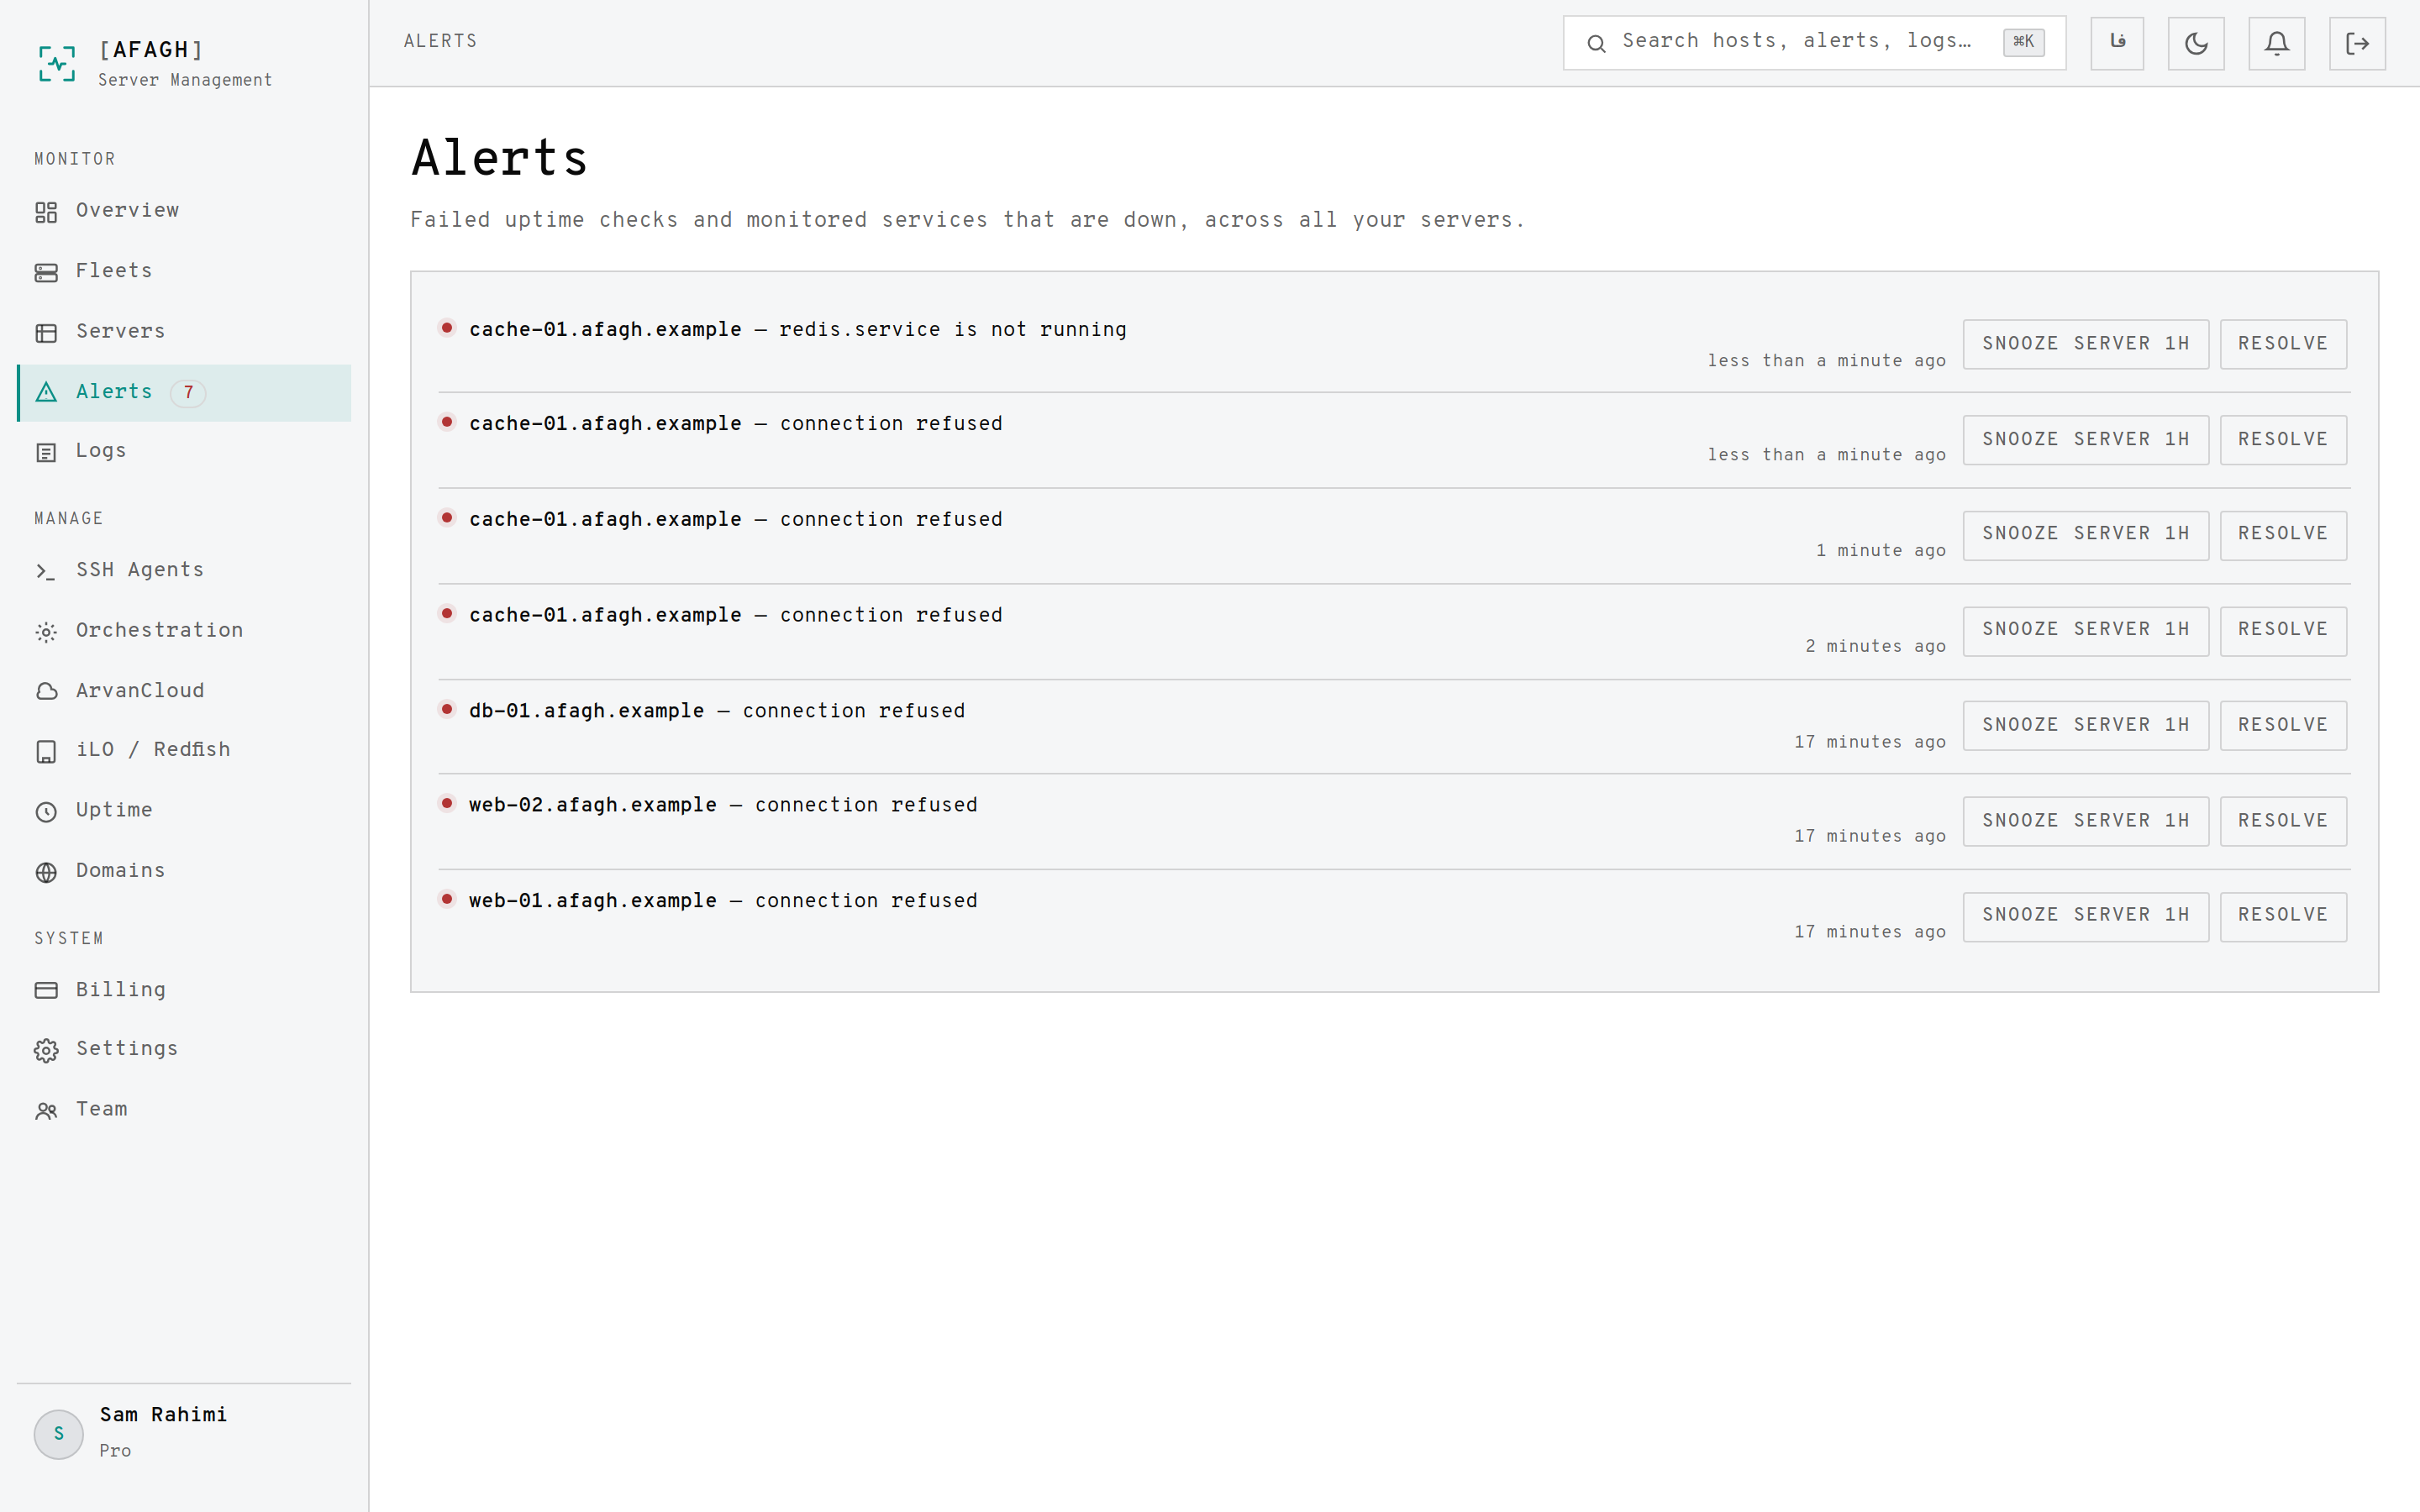
Alerts come from two places: failed uptime checks and monitored services that have gone down. They appear on the overview, on the affected server, in the sidebar counter, and on the Alerts page.
When you get told
Notifications fire on the transition — when something goes down, and again when it recovers. They do not fire on every failed poll in between, so an hour of downtime is one message, not sixty.
Delivery channels
Email, webhook, Slack, Telegram and SMS. Each channel has its own minimum severity, set per team member, so you can send everything to a webhook but only critical alerts to SMS. Which channels you can use depends on your plan.
Maintenance windows
Opening a maintenance window on a server hides its alerts for the duration. Checks keep running and results keep being recorded — only the alerting is muted — so the real picture is accurate the moment the window ends.
Services & auto-restart
The agent reports every systemd unit on the server. Any unit can be marked:
- Monitored — an alert opens if it stops running.
- Auto-restart — Afagh tries to restart it for you when it fails.
Auto-restart respects a retry ceiling and a backoff interval, both of which you set. A service that exhausts its retries stops being restarted and escalates to an alert instead — so a genuinely broken service reaches you rather than flapping forever.
You can also start, stop and restart any service by hand from the Services tab.
SSH agents
An SSH agent is a reusable bash script — install a package, run a health check, roll a deploy — that you can run against any server.
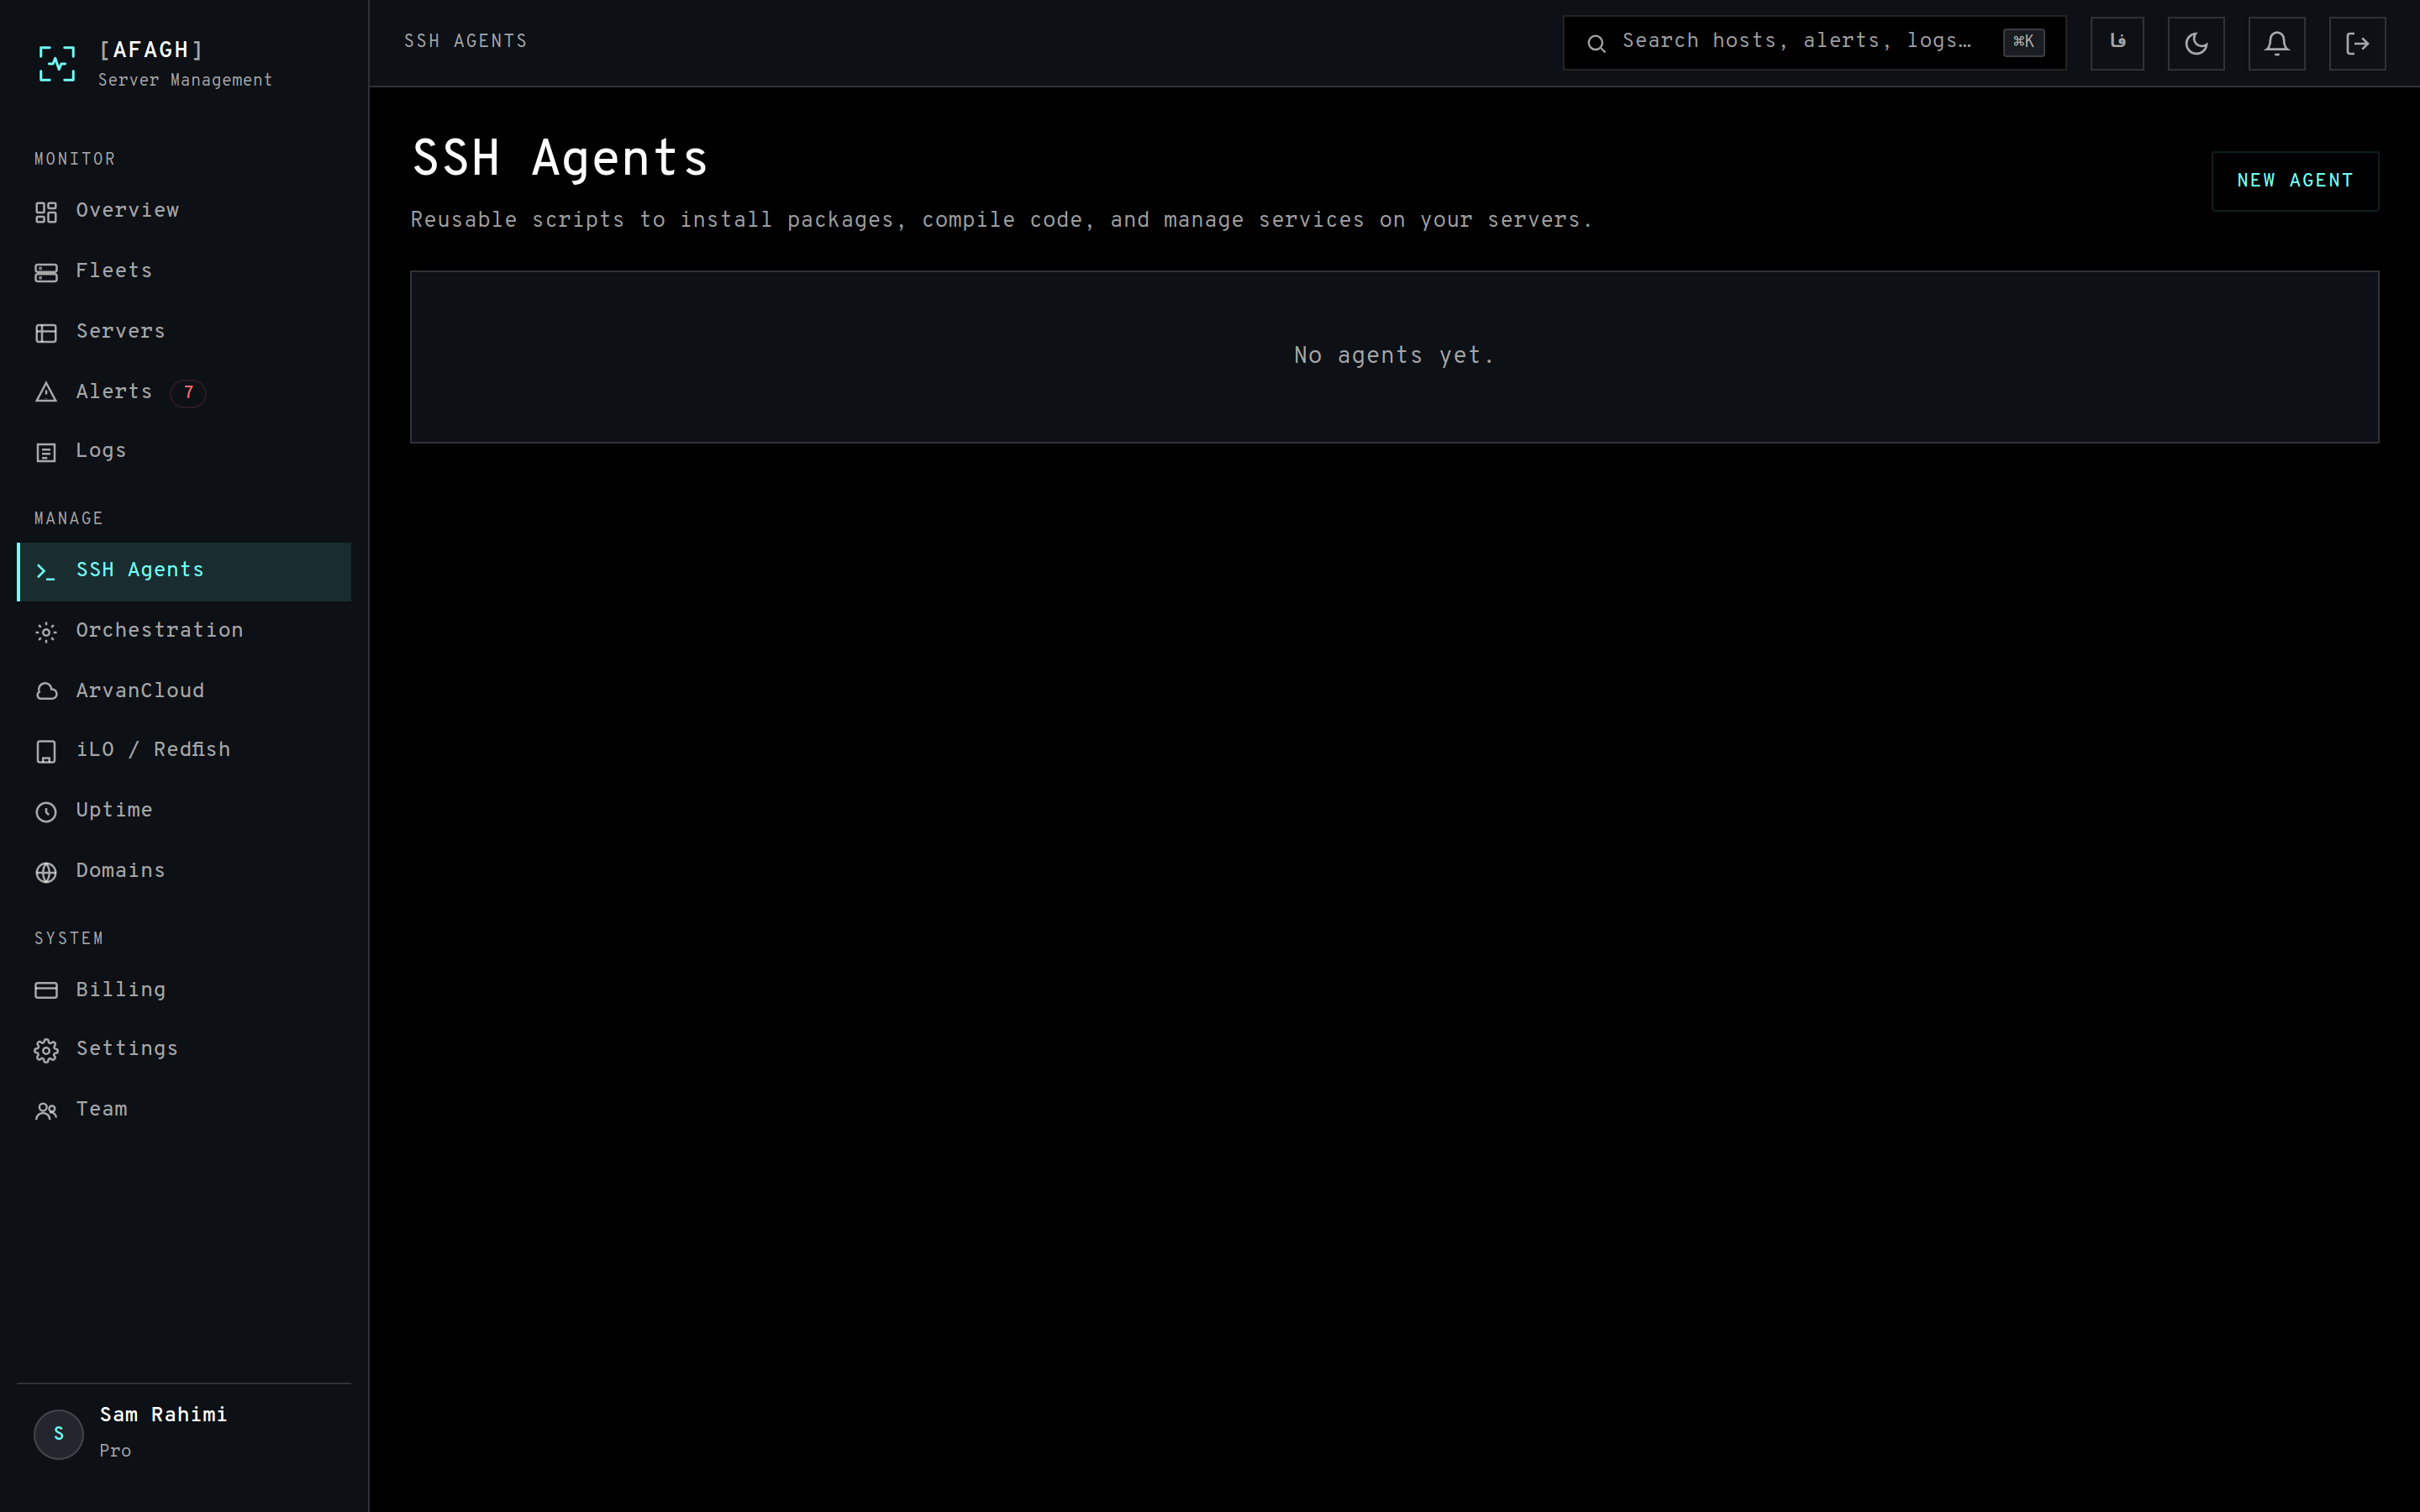
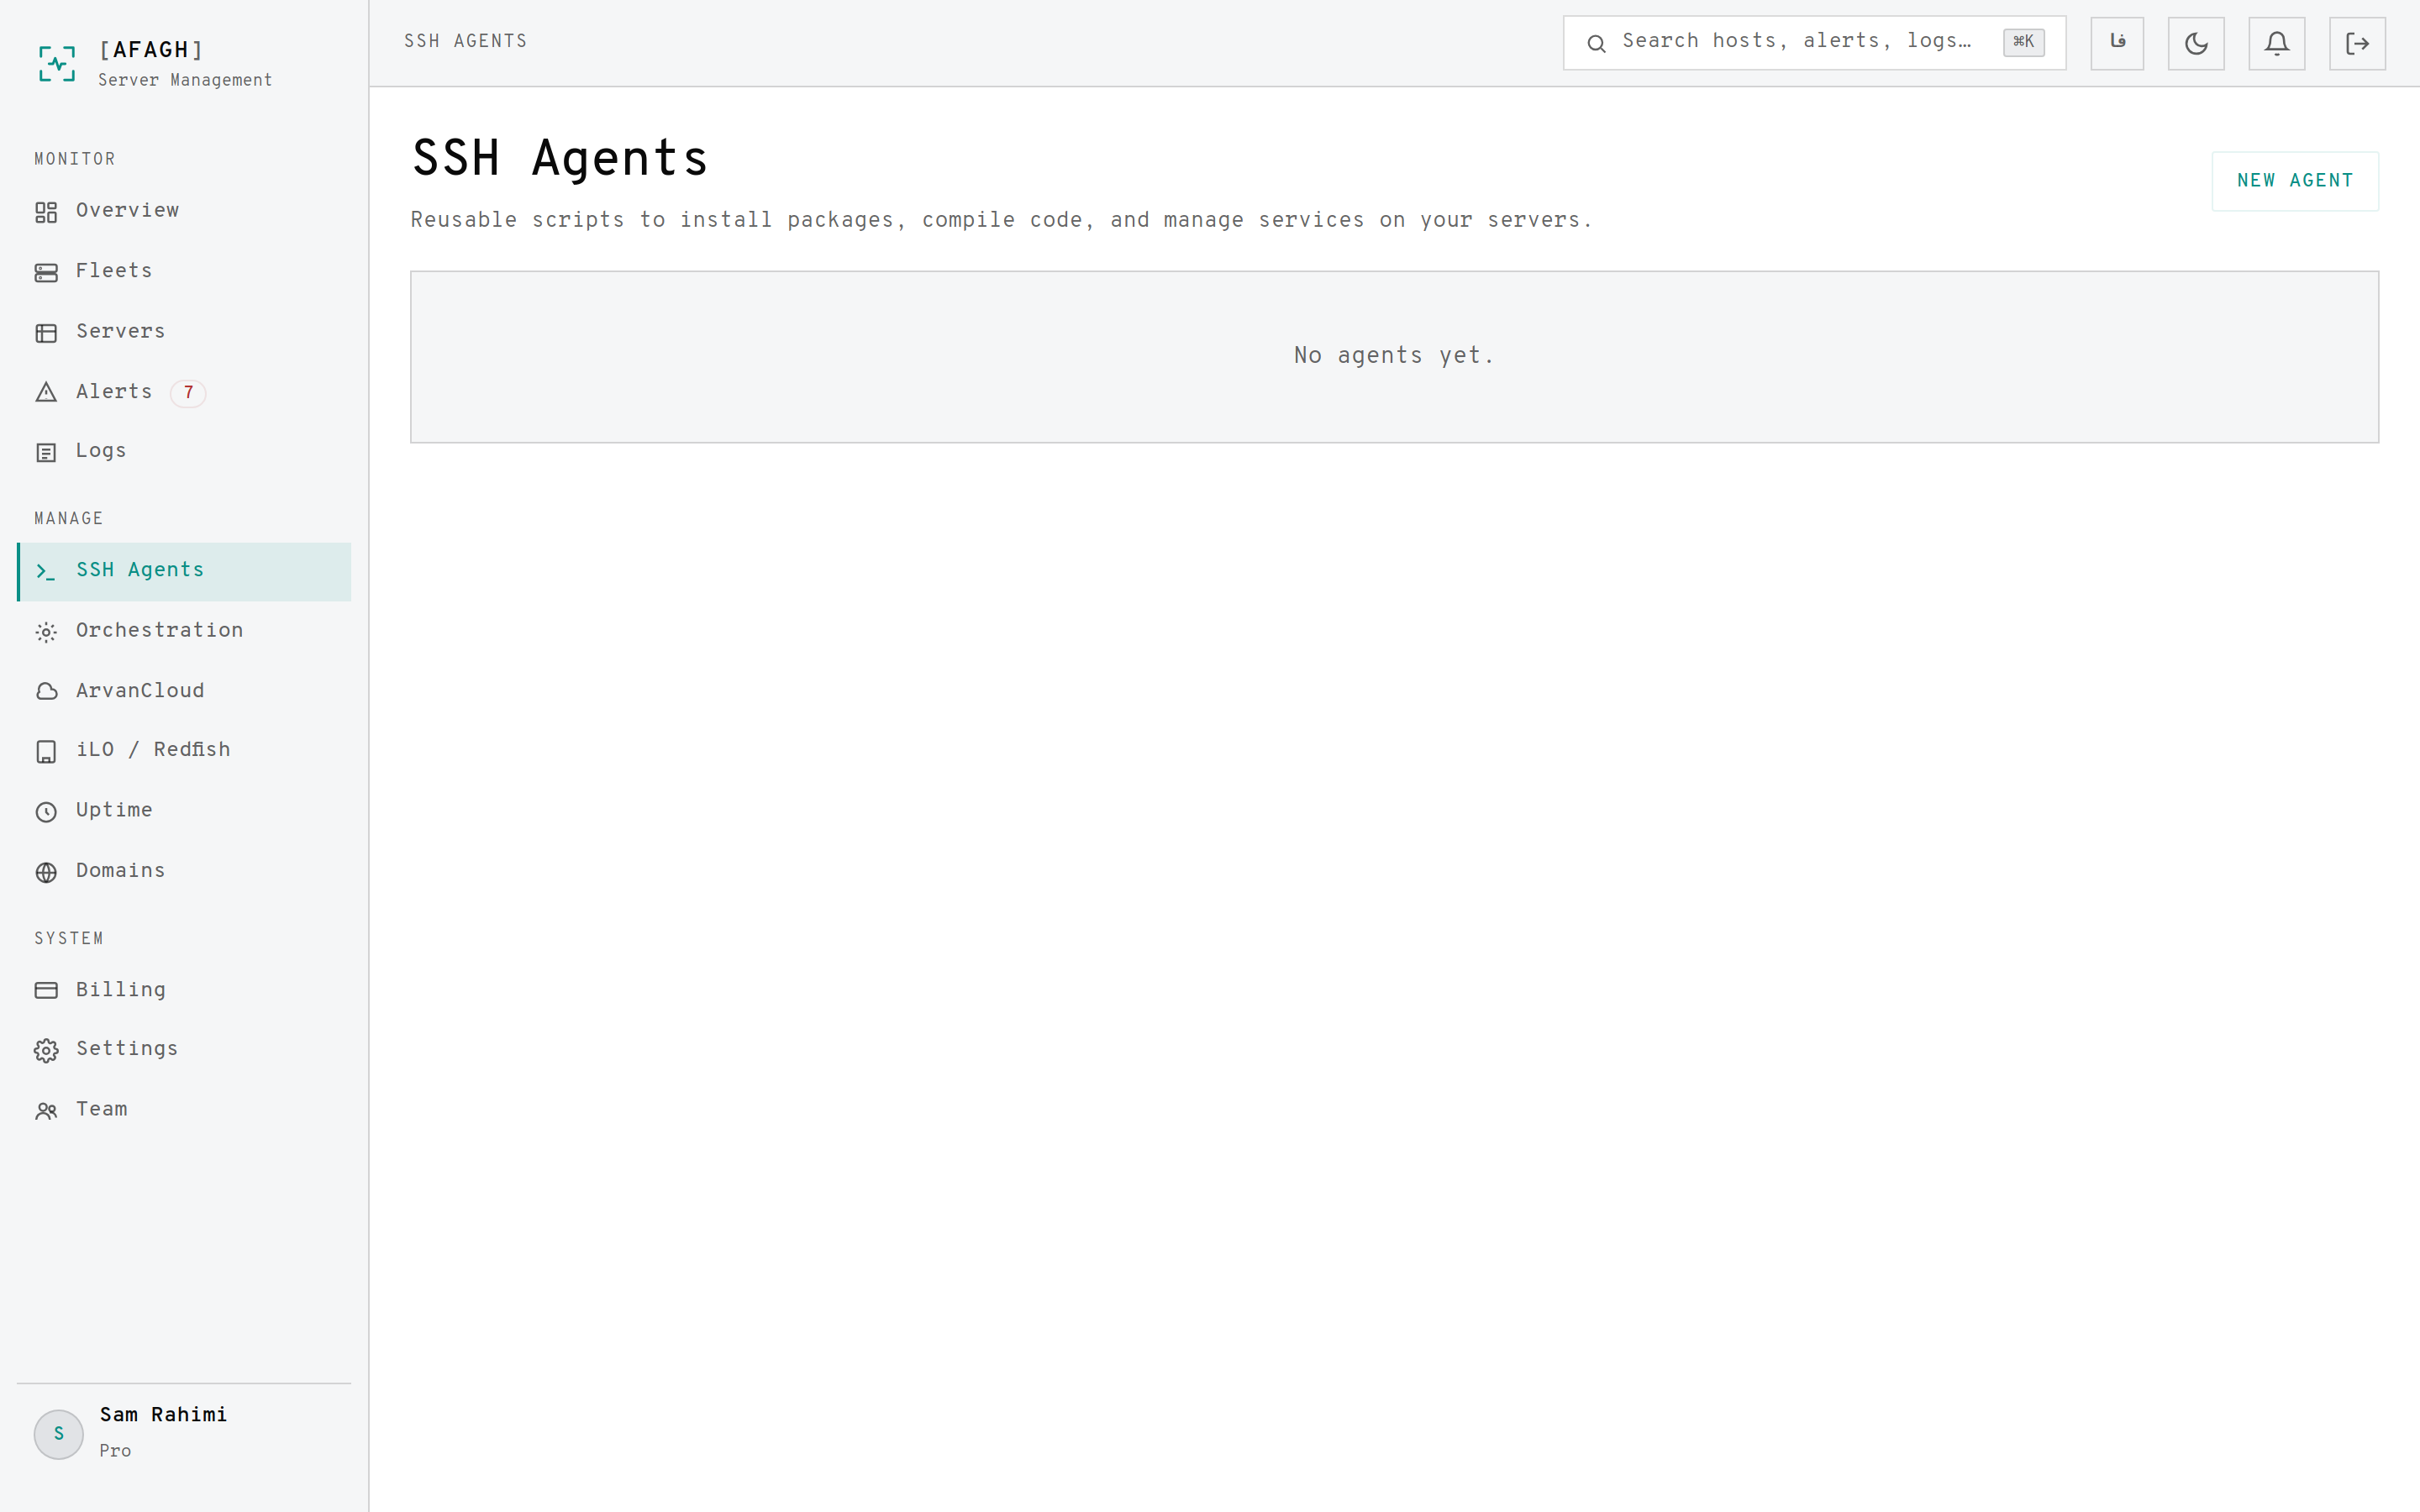
- Runs go over the server's live agent connection, falling back to direct SSH when it is offline.
- Output streams back live and is kept in the run's history.
- Predefined agents cover common tasks; you can write your own from Settings.
Orchestration
An orchestration chains several SSH agent scripts into ordered steps and runs them across a chosen set of servers.
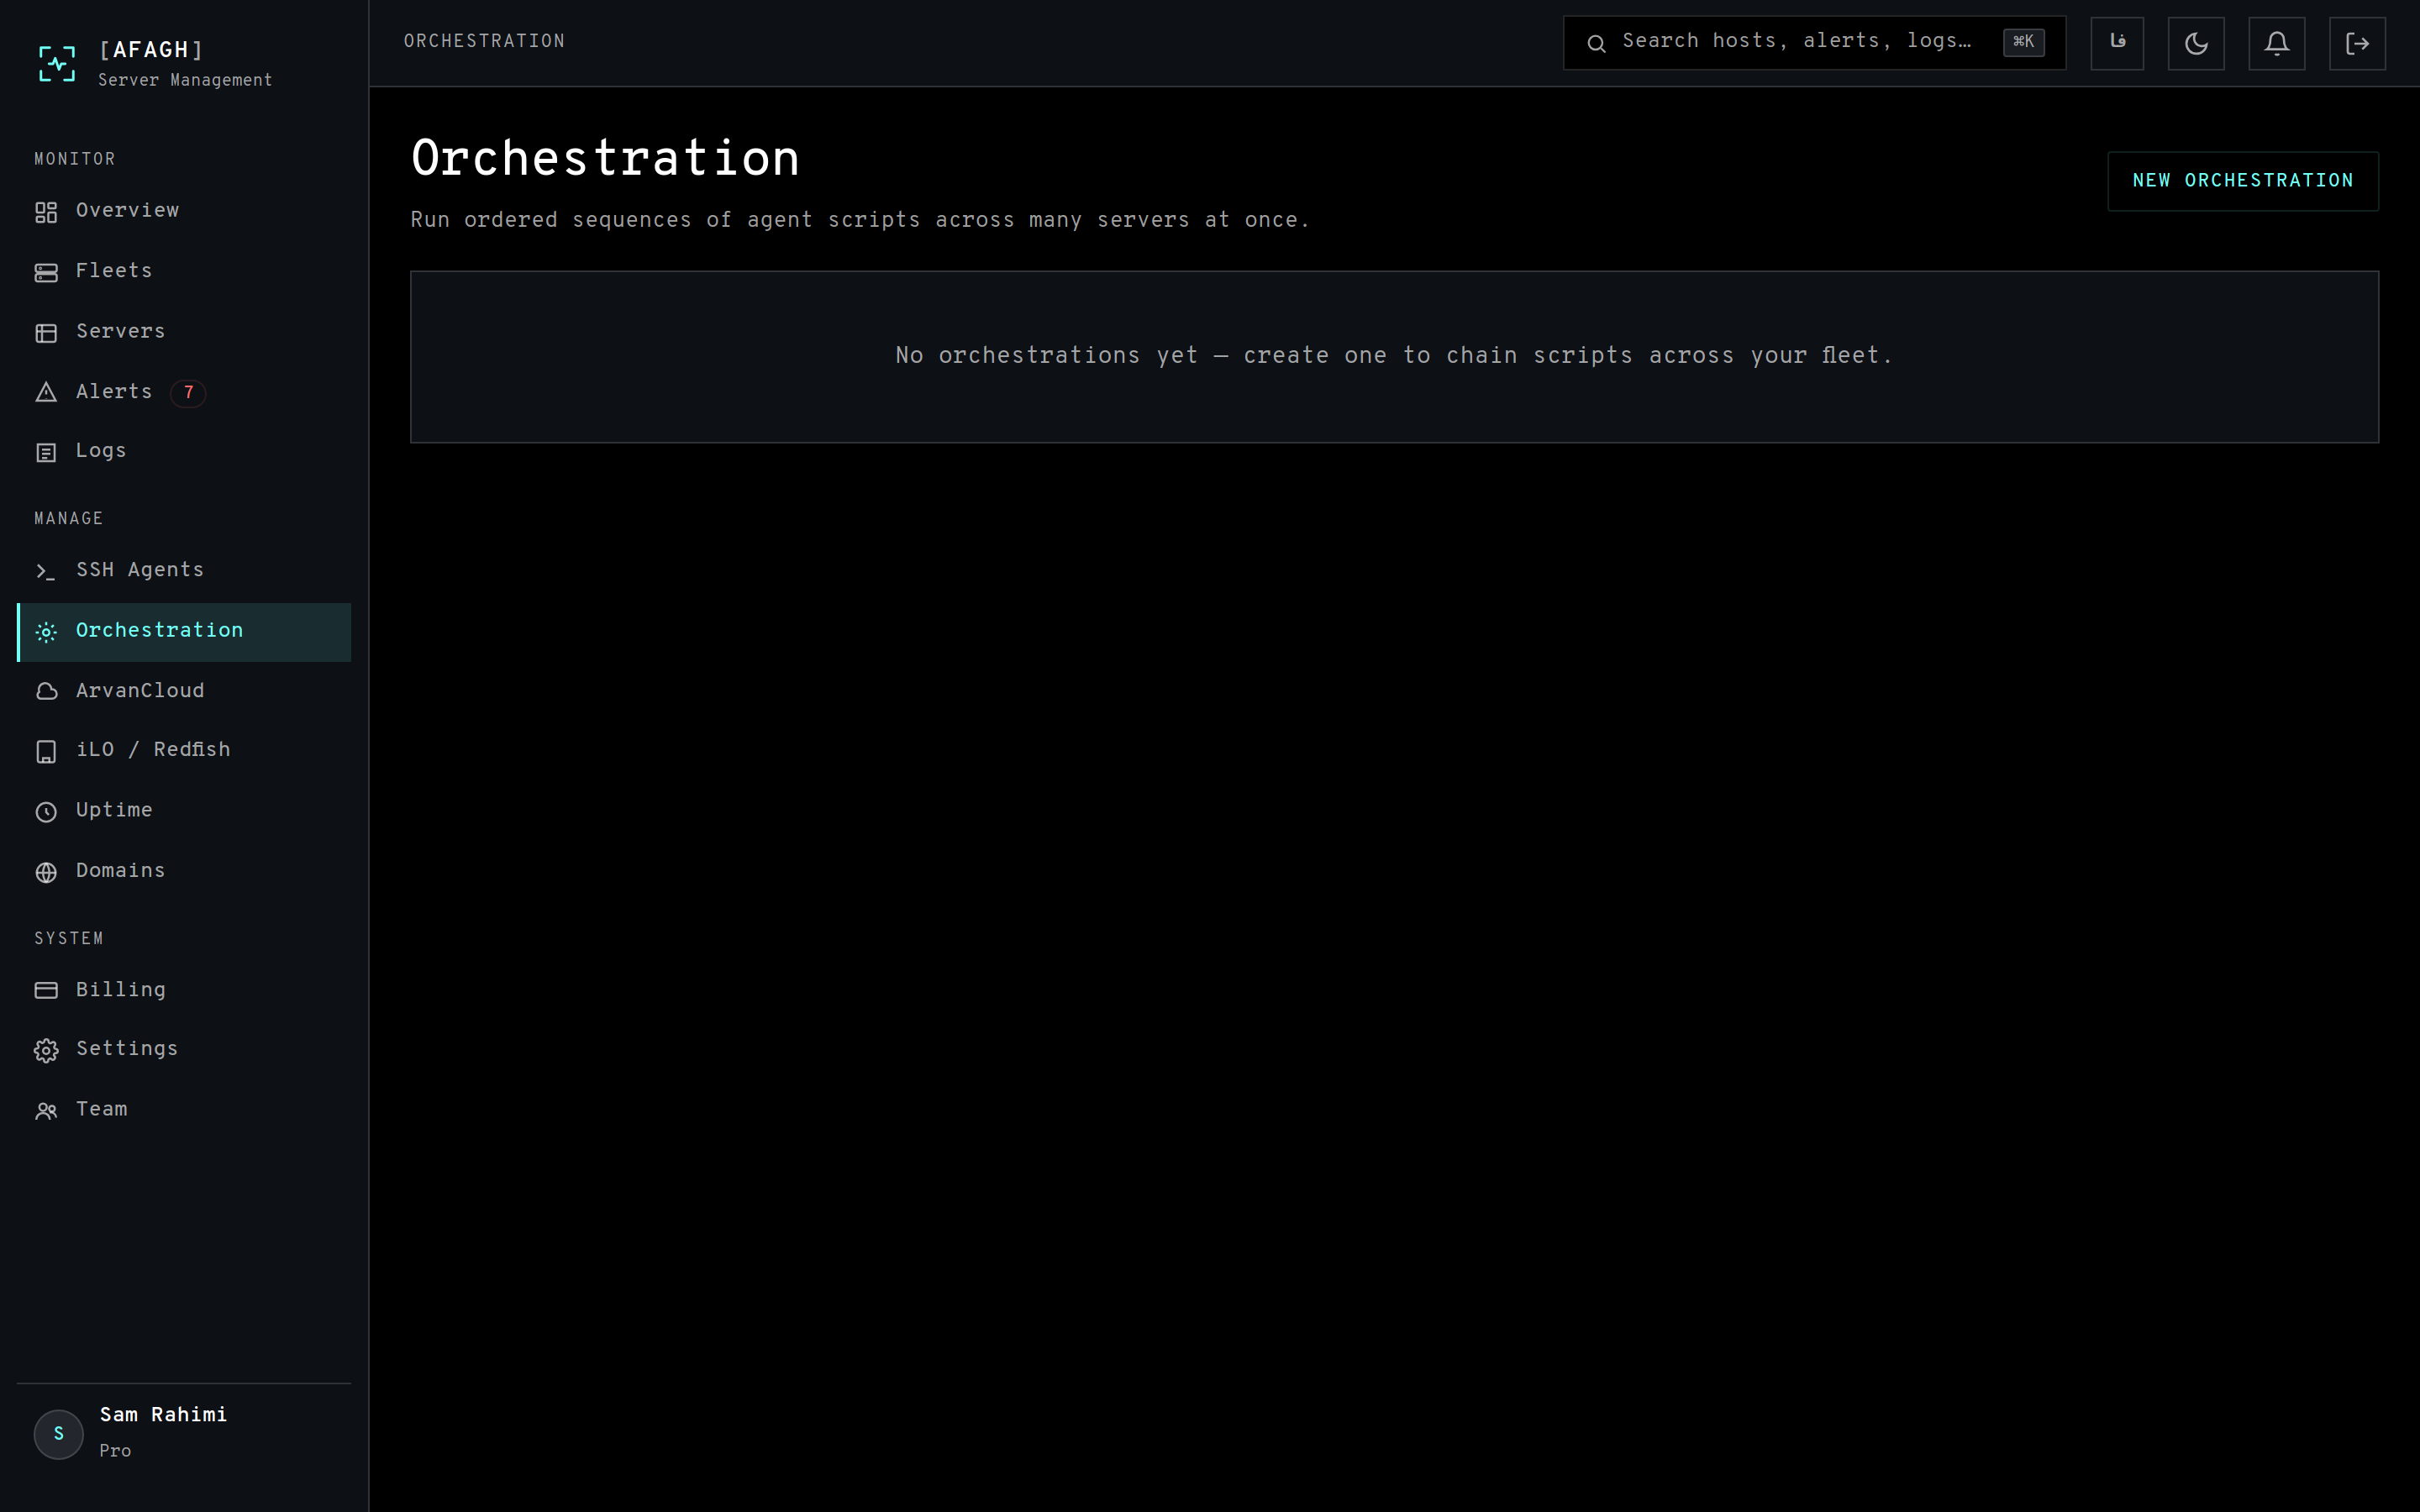
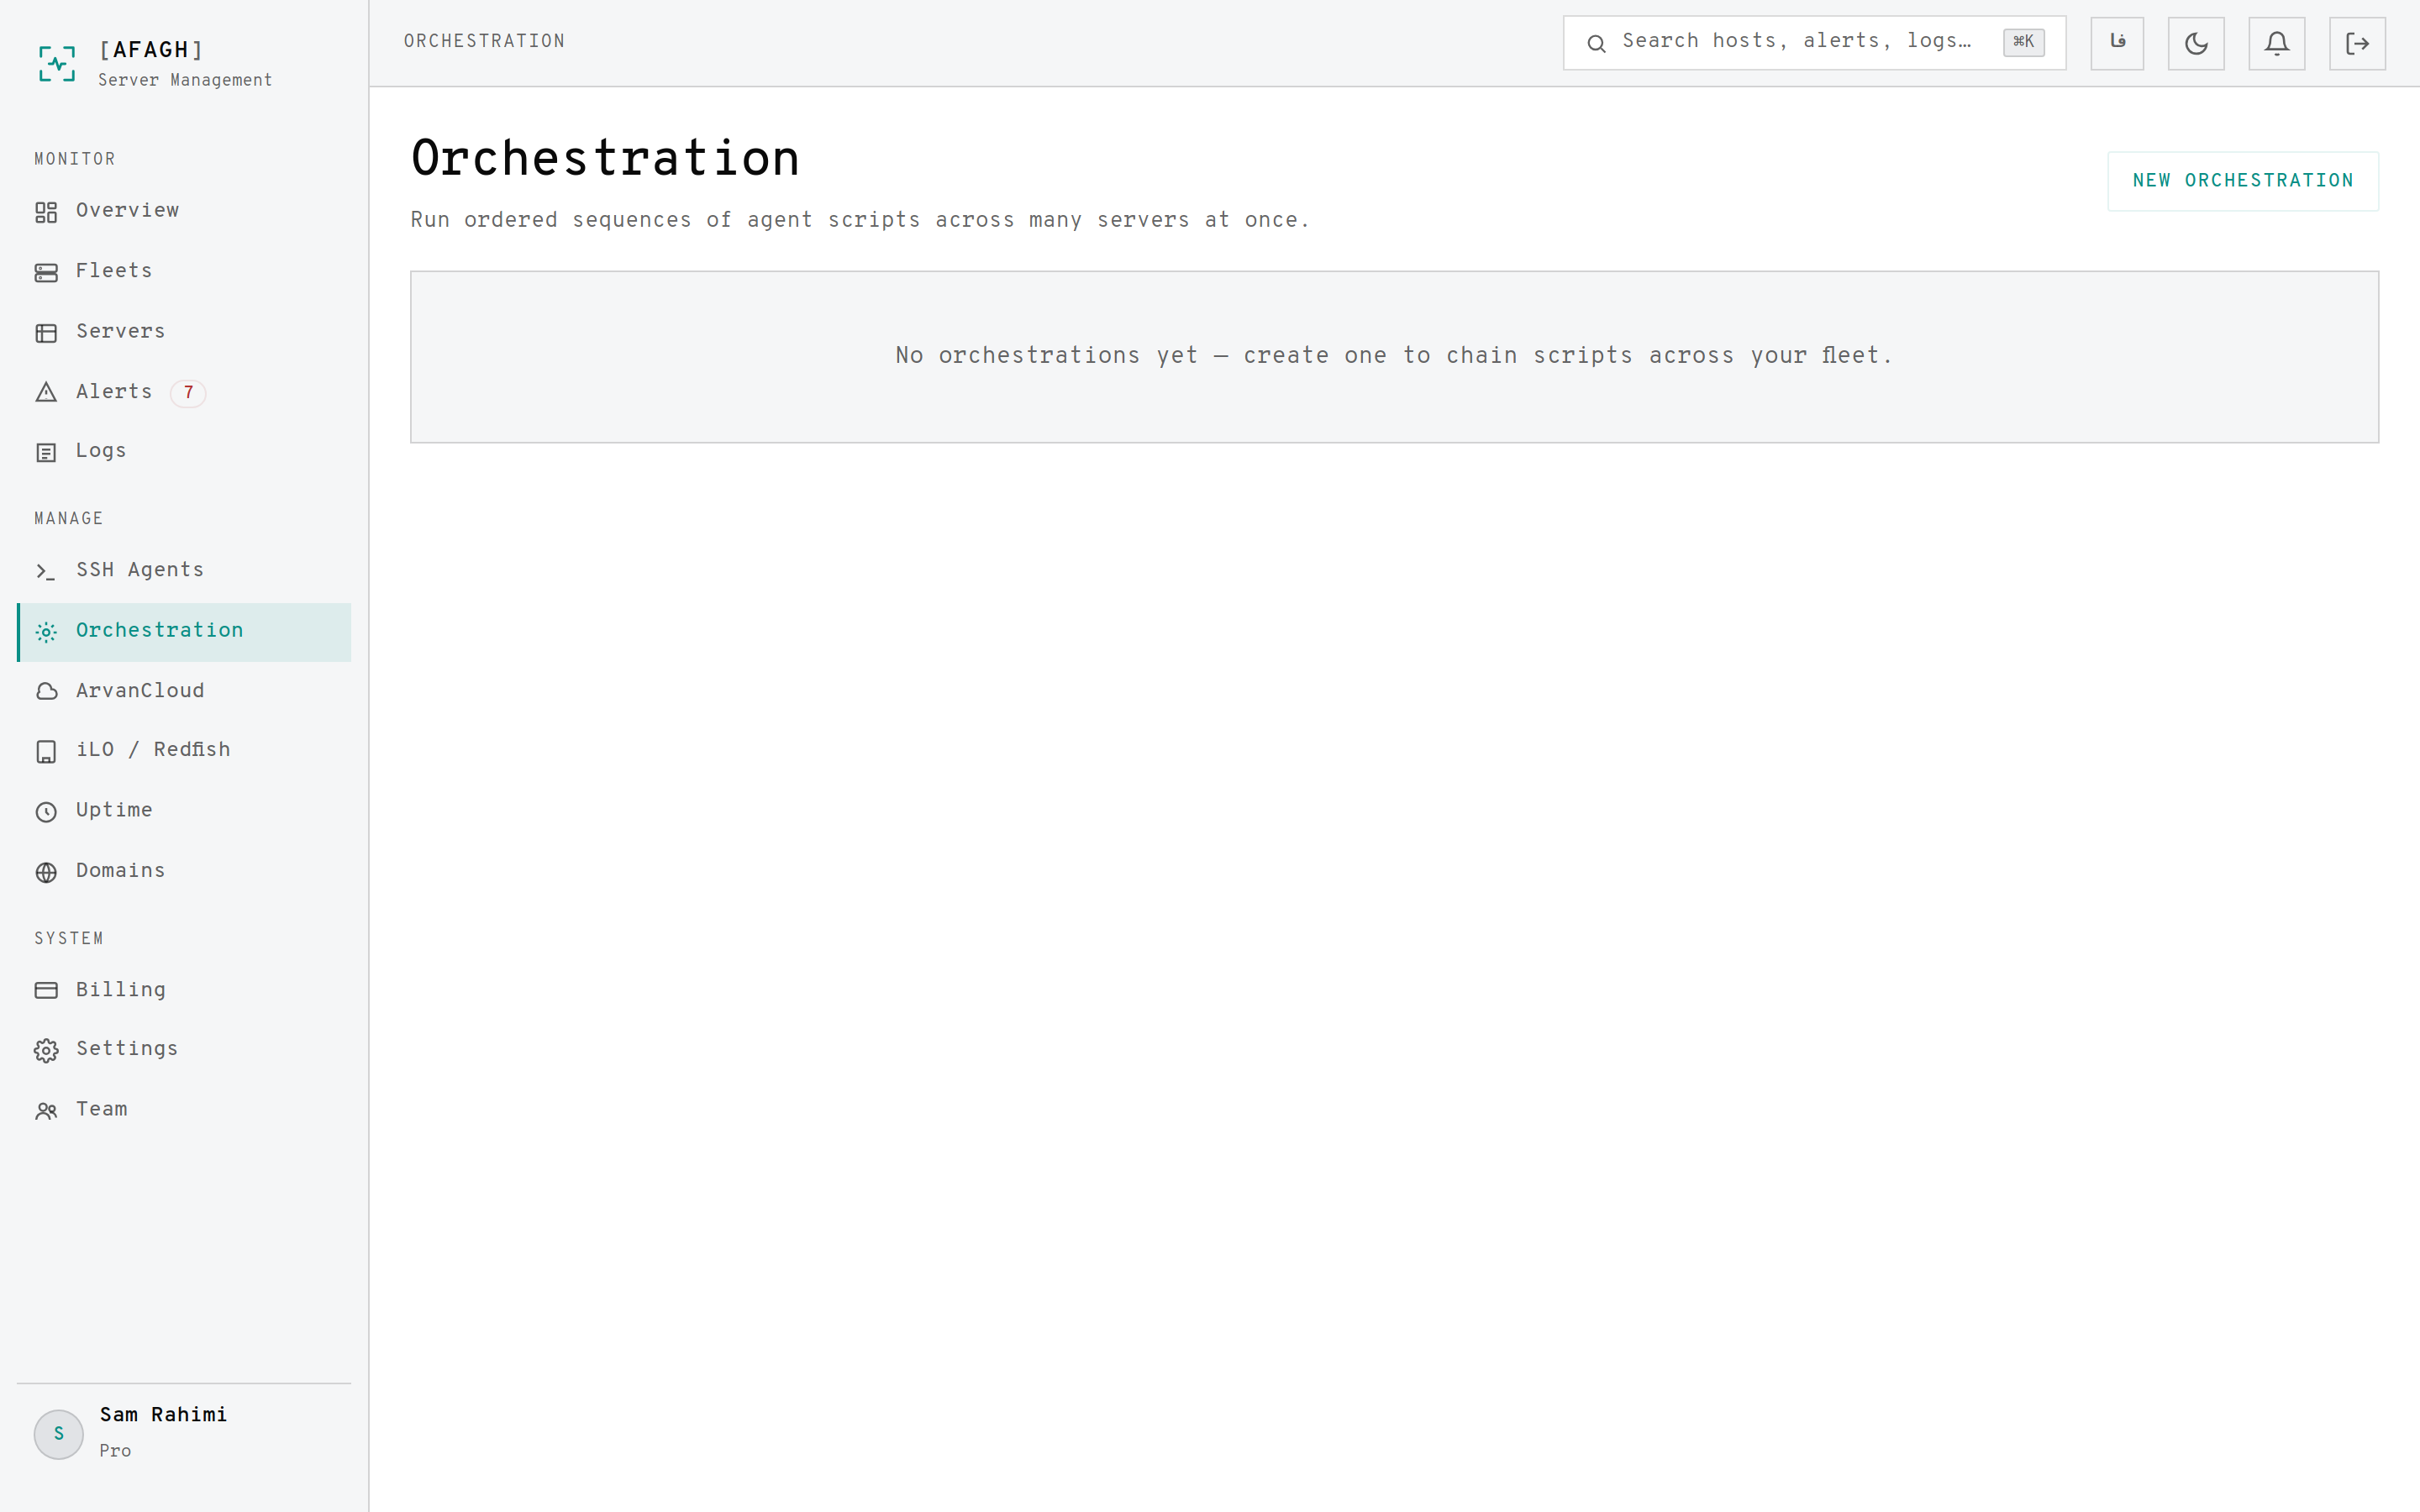
- Each step runs on every selected server in parallel.
- By default the whole run halts if a step fails anywhere, so a bad step cannot cascade into later ones.
- Runs can be scheduled, and every run keeps its full output per host.
Use this for coordinated changes — a package upgrade, then a service restart, then a health check — across many servers at once.
Cloud & hardware
ArvanCloud
Connect an ArvanCloud API key to pull in your cloud server inventory across every region on that account. From there you can power-cycle, resize, rebuild, snapshot or terminate instances, and open the VNC console — without leaving Afagh.
HPE iLO / Redfish
Connect to an iLO management controller over its Redfish API to monitor hardware health without needing the OS agent installed. Afagh polls thermal, power, storage and network telemetry and raises an alert on any degraded subsystem. Power control, the UID light, boot override and remote reset are all available.
Caddy & tunnels
Where Caddy is running, its reverse-proxy status is surfaced alongside the server. Secure tunnels let you reach services that are not exposed to the internet.
Settings & notifications
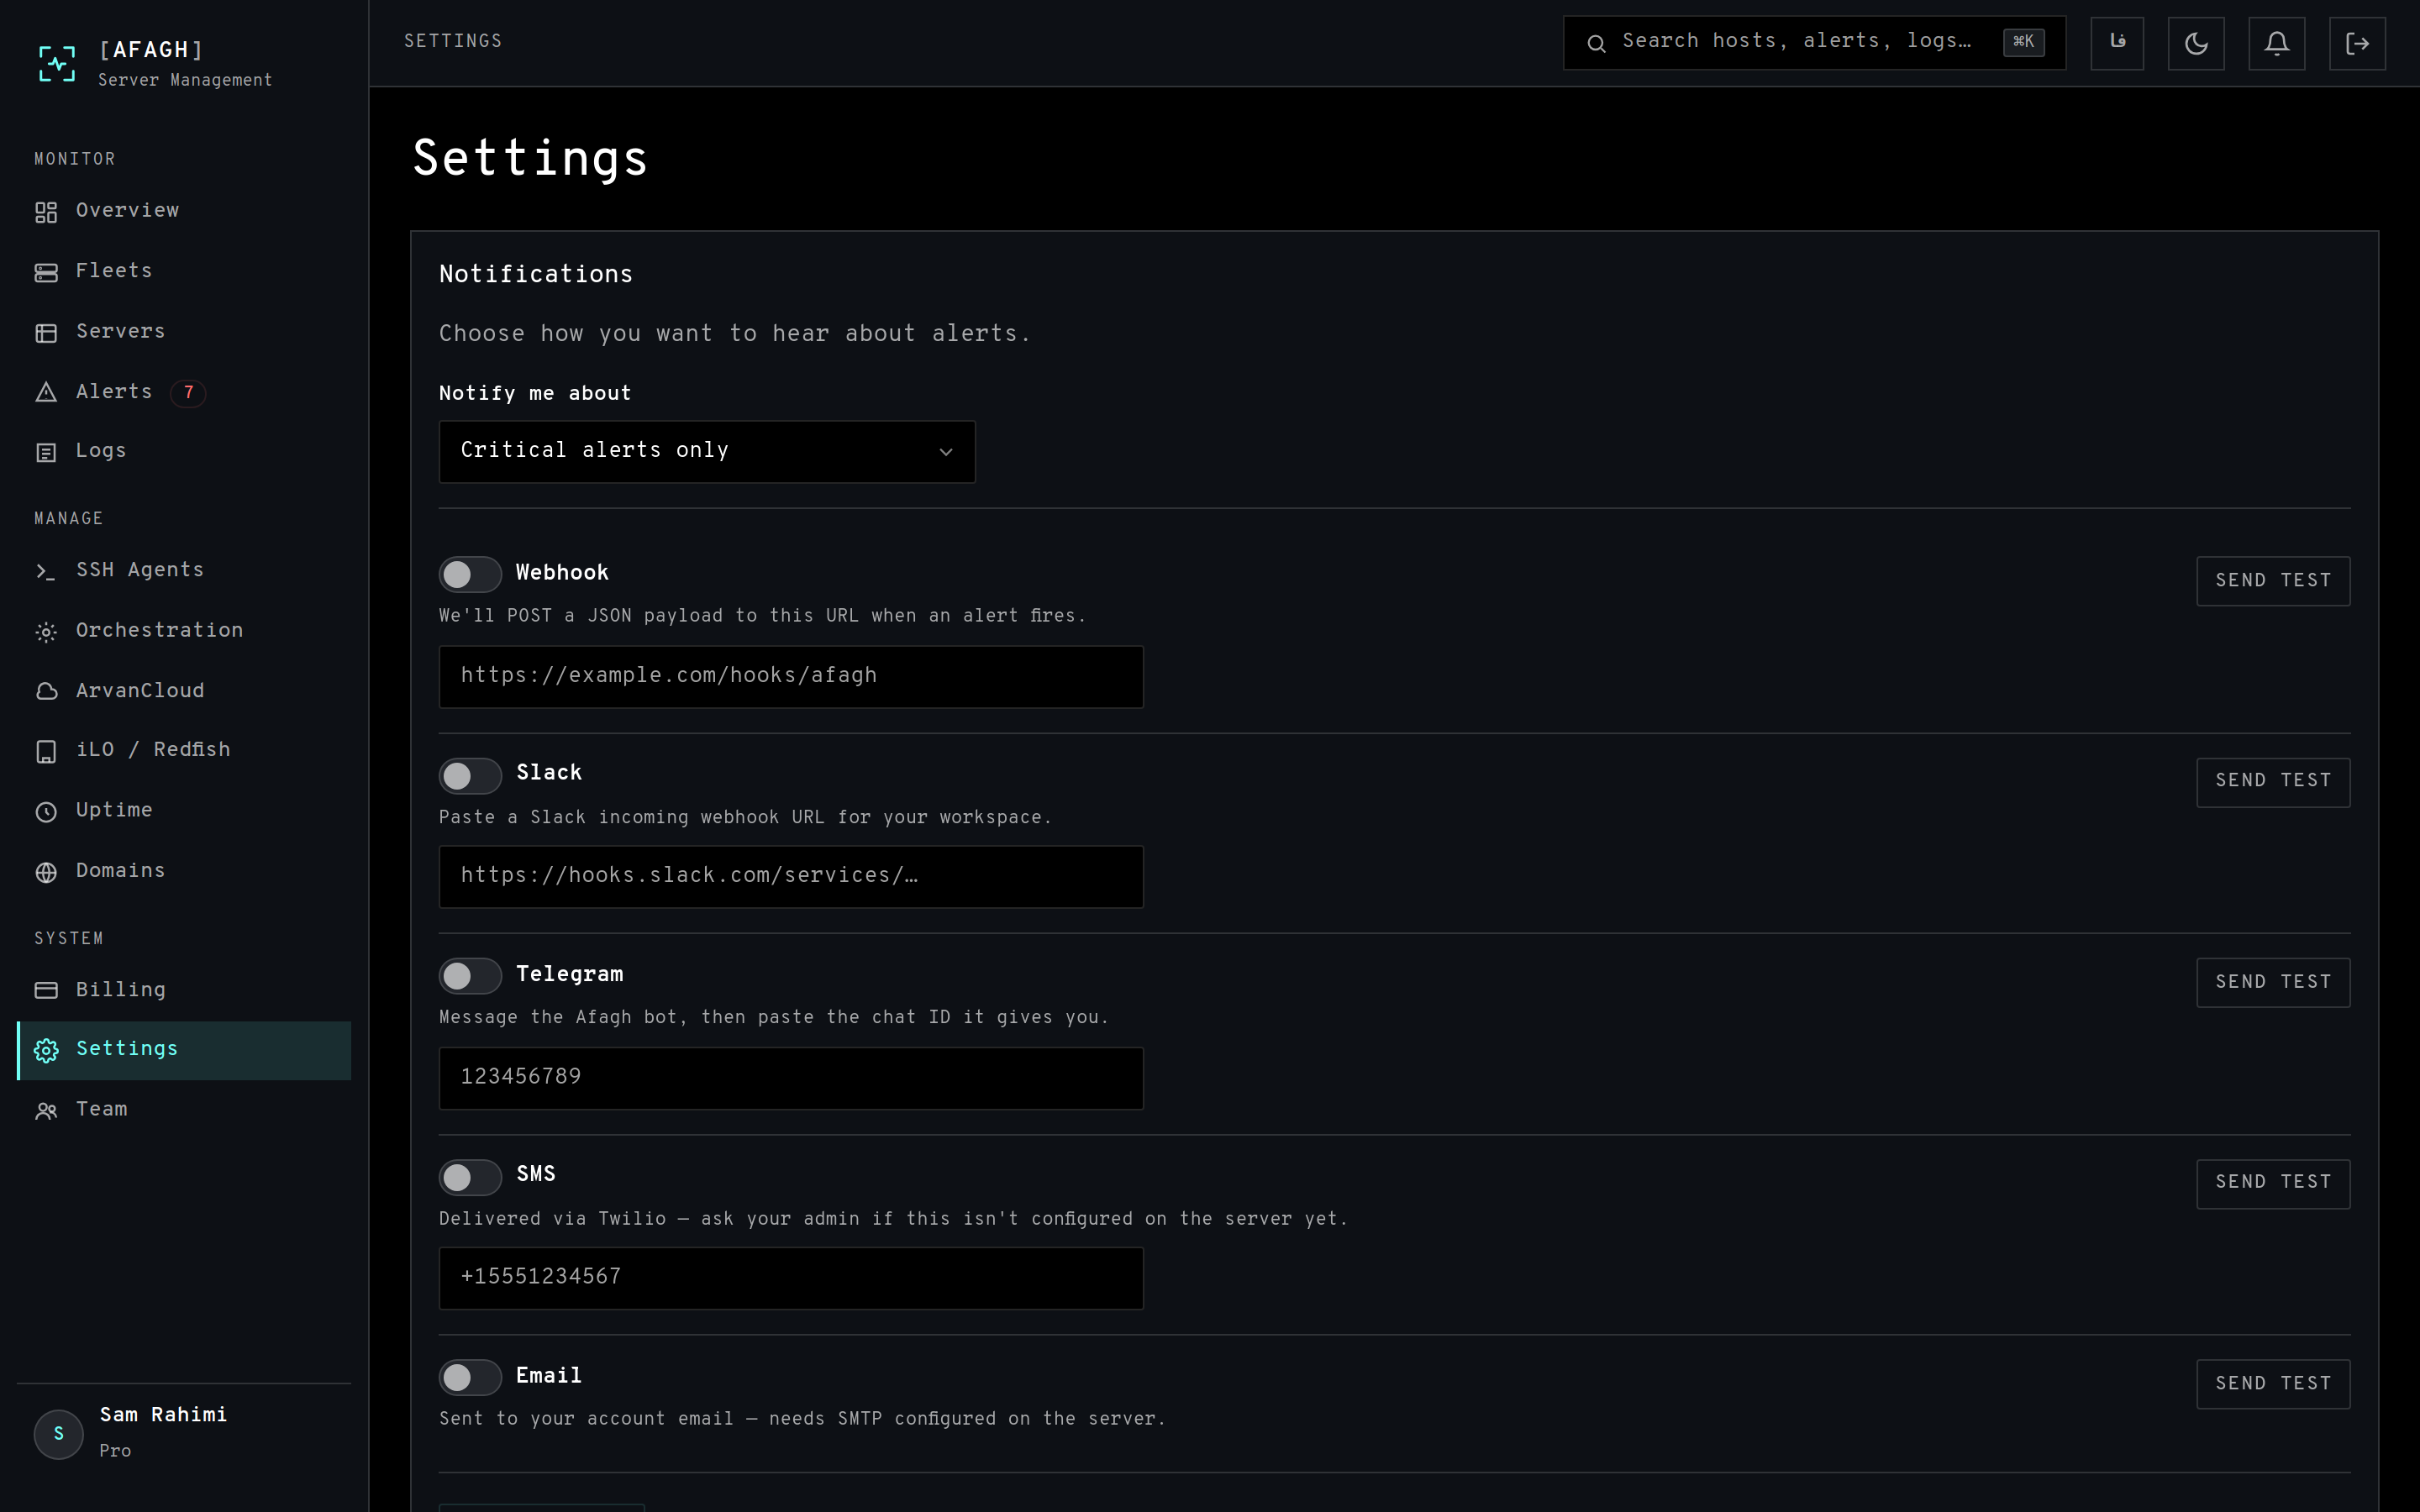
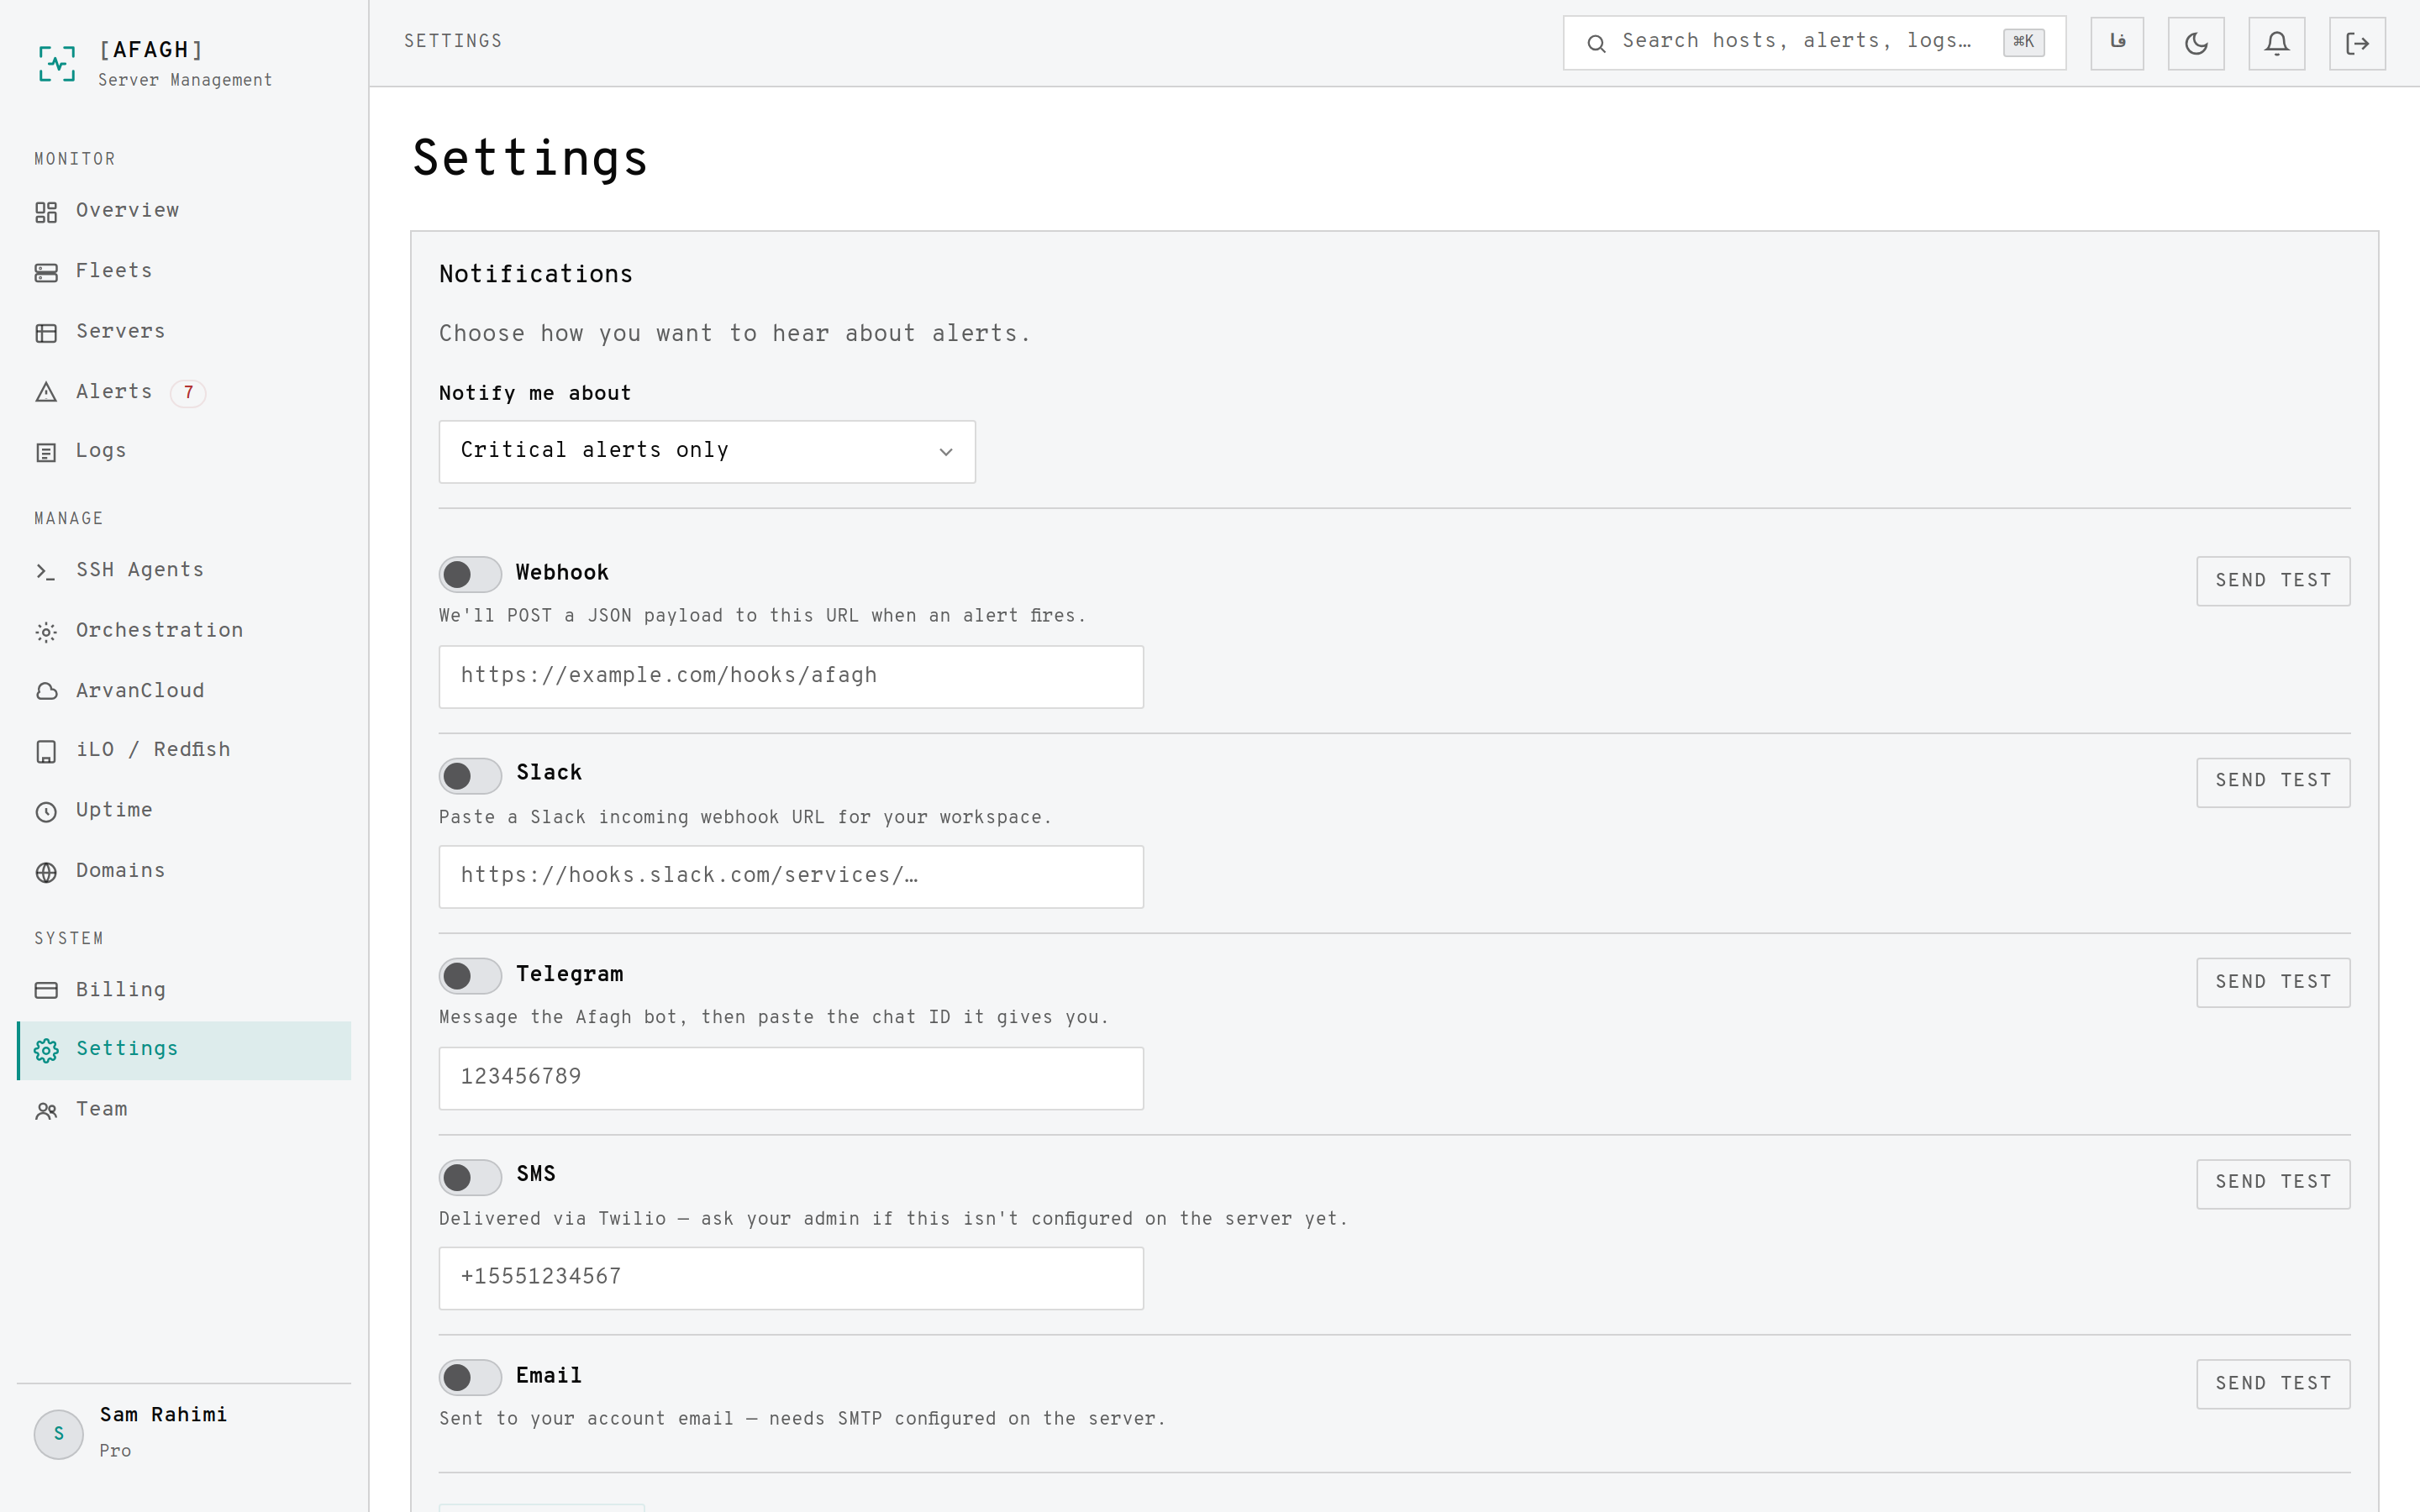
Settings is where you configure notification channels and the minimum severity for each, manage your SSH agent scripts, and adjust account-wide metric options. Notification preferences are personal — each team member has their own.
The interface is available in English and Persian, and follows right-to-left layout in Persian. Switch language from the footer of any page.
Team & roles
Invite teammates from the Team page — they receive an email with a link to accept and set a password. Team members share the account's fleets, servers, alerts and billing, but keep their own notification settings.
Only the account owner can invite or remove members and manage billing.
Billing & plans
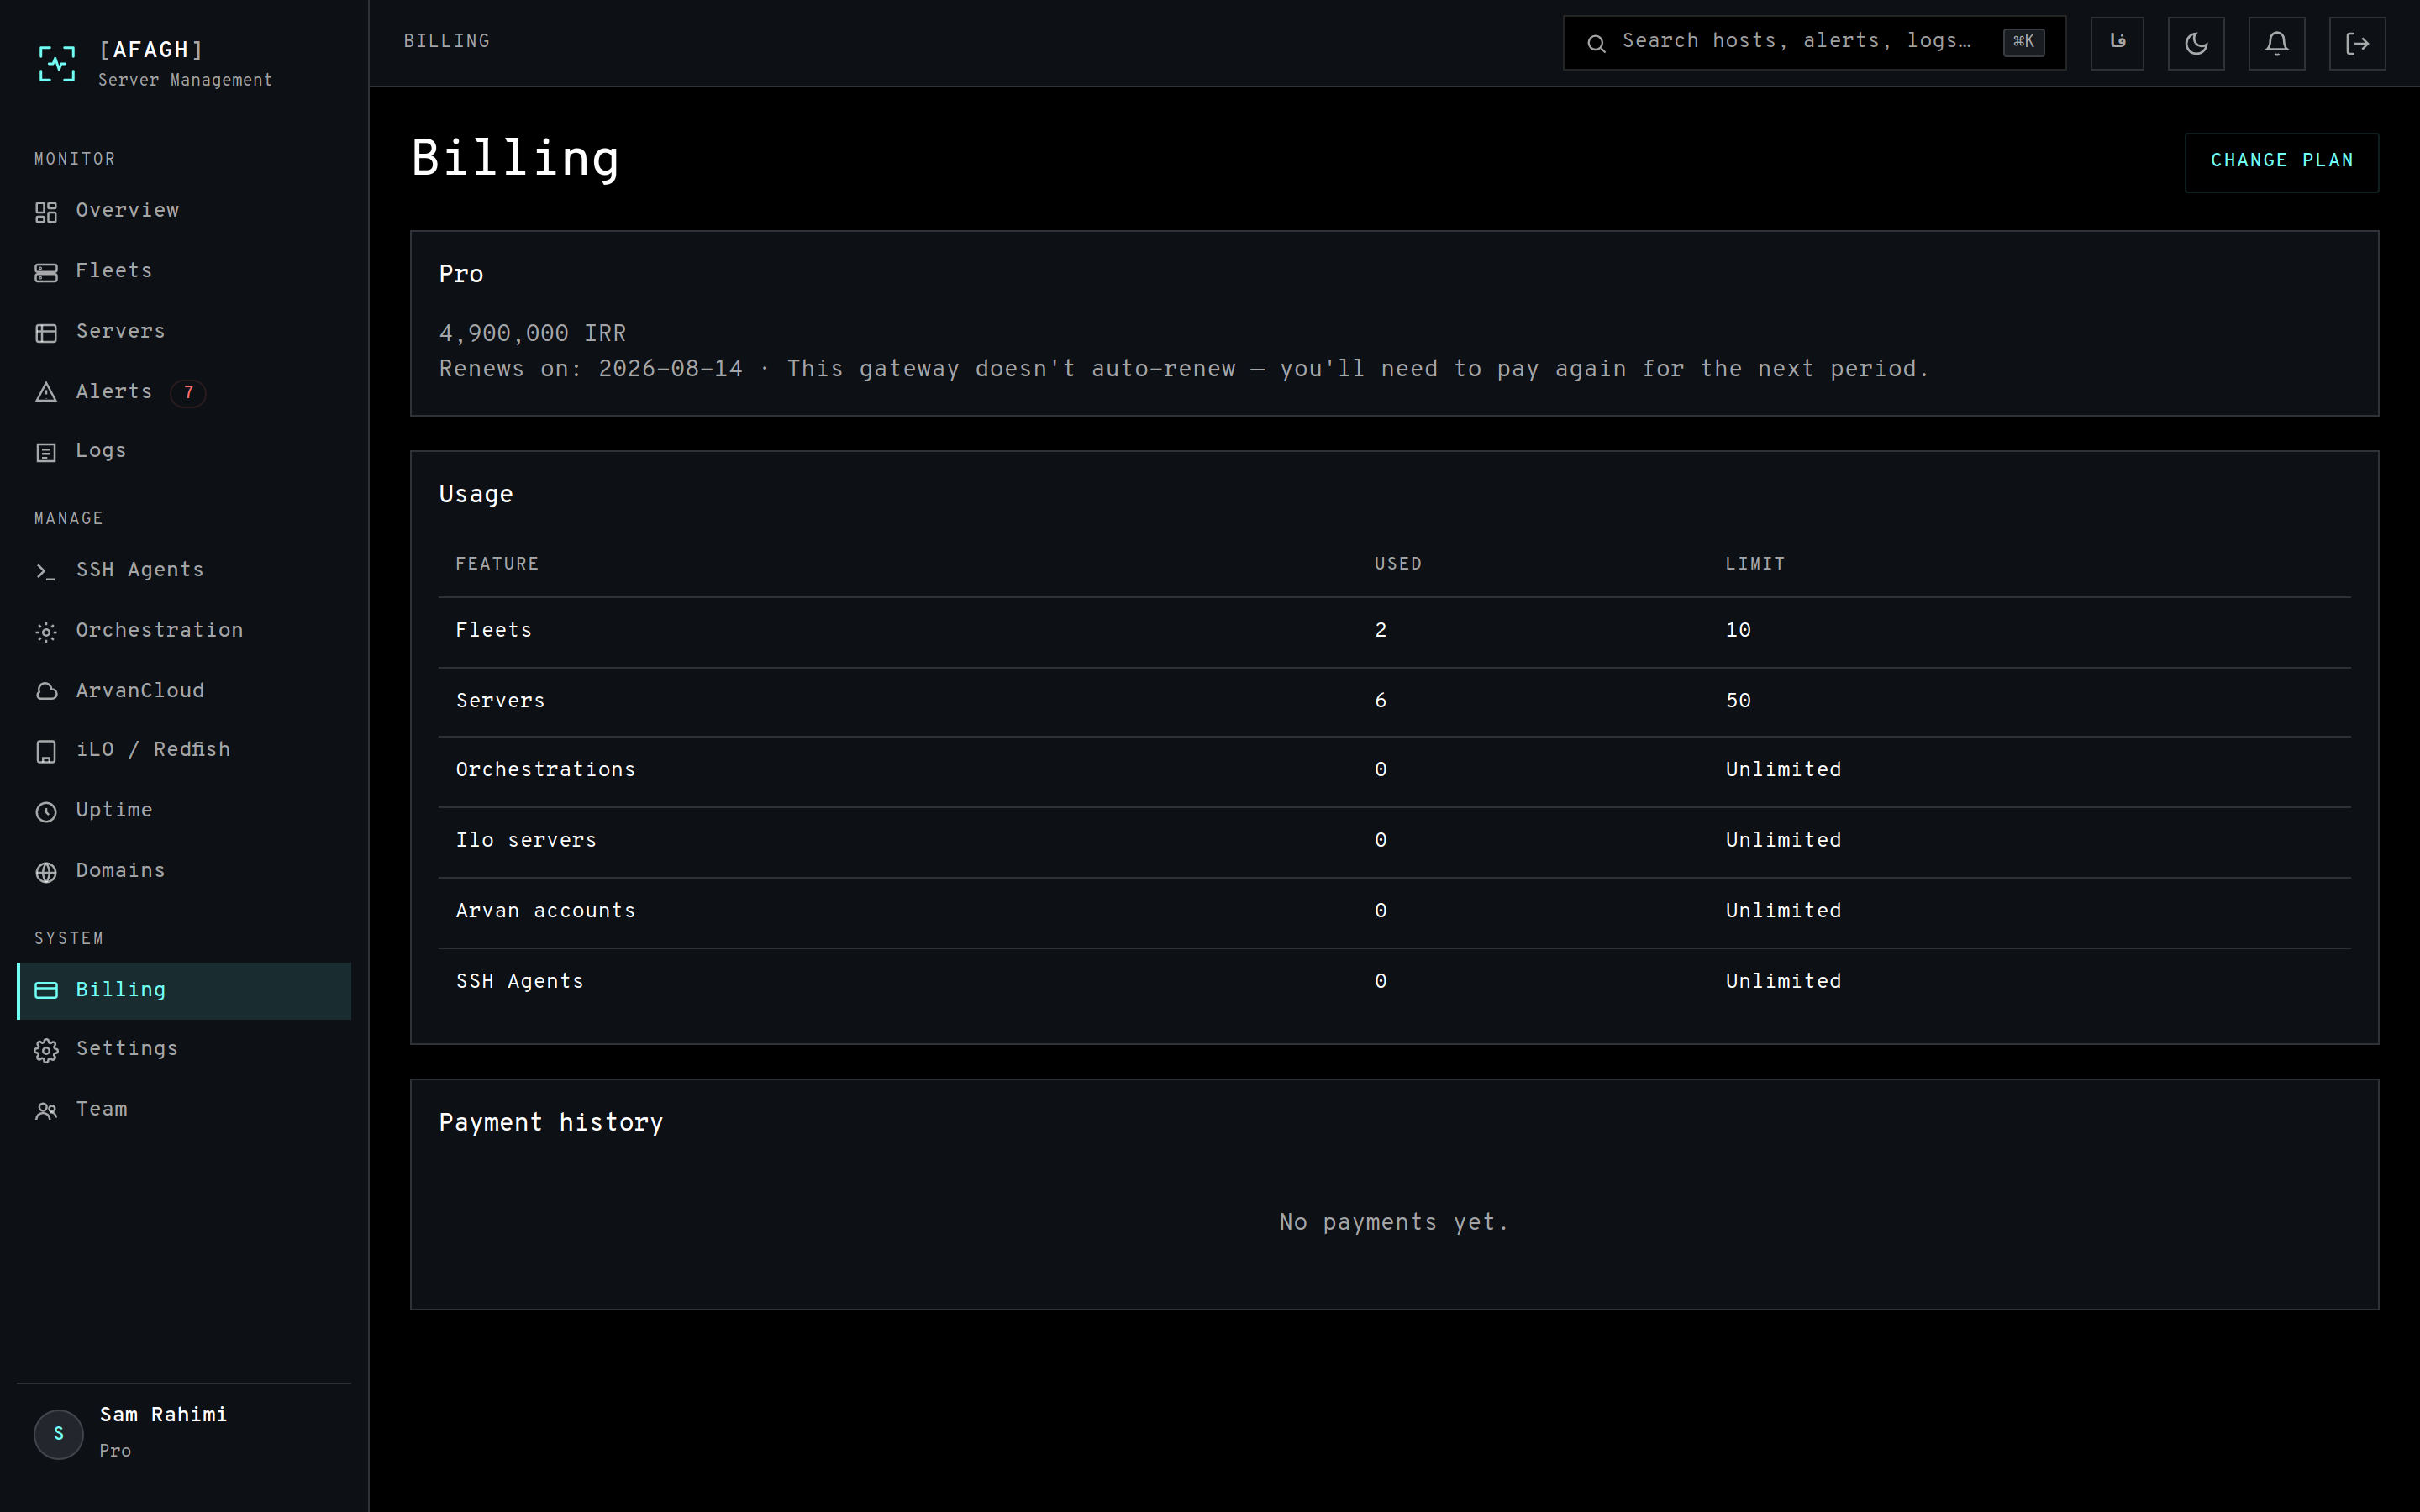
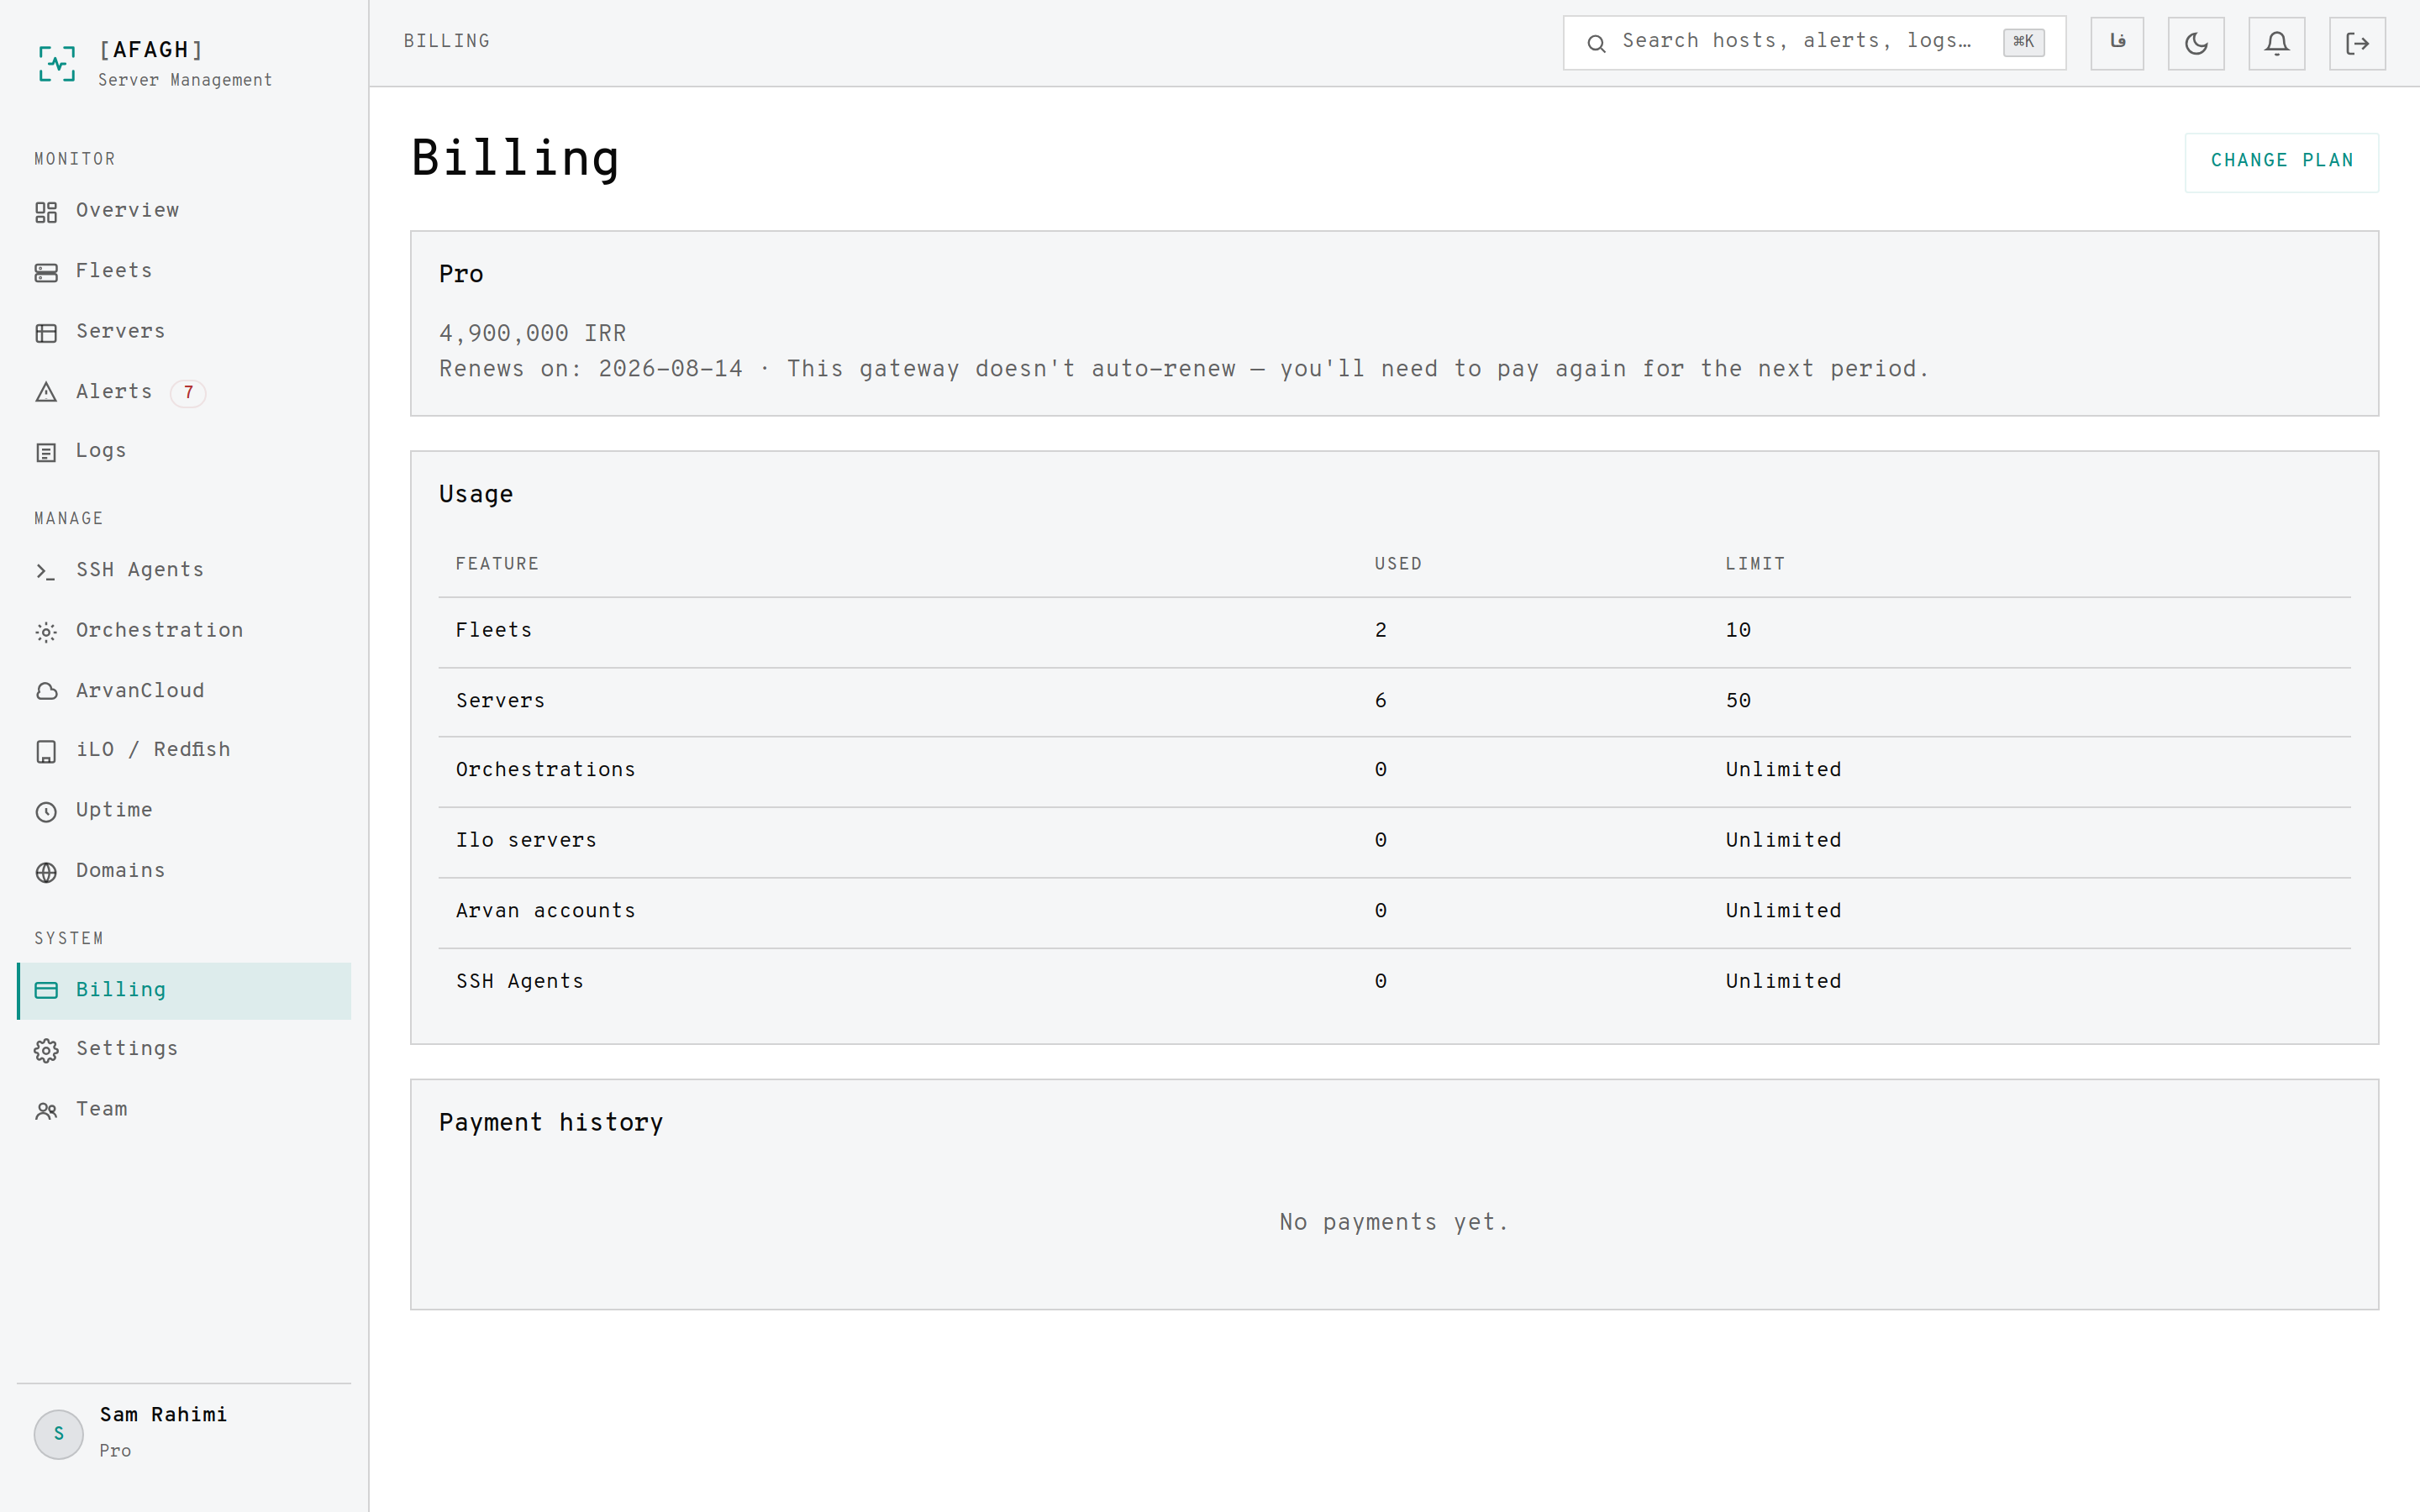
Your plan sets how many fleets, servers, SSH agents, orchestrations and cloud or BMC integrations you can have. The Billing page shows current usage against each limit, alongside payment history.
When you reach a limit, adding another of that resource is blocked until you upgrade. Nothing already running is switched off or throttled.
Need to keep everything inside your own network? On-premise deployment is available — use the on-premise form on the main site to start that conversation.
Troubleshooting
A server shows as offline but it is running
The agent has not reported for more than 90 seconds. Check that the agent service is running on the host, and that it can reach Afagh outbound. The Agent tab shows the last install log and the current connection state.
An uptime check fails but the site works in my browser
Check the recorded error on the check's page. A common cause is that the endpoint is only reachable from inside your network — a tunnel, or a check bound to an internal address, will resolve that.
I am not receiving notifications
Confirm the channel is enabled in Settings, that its minimum severity is not above the alert's severity, and that your plan includes that channel. Remember that notifications only fire on transitions, not on every failed poll.
A service keeps restarting
Once auto-restart exhausts its retry ceiling it stops and raises an alert. Raise the ceiling or lengthen the backoff if the service simply needs longer to come up; if it is genuinely broken, the alert is the signal to go and look.